
Sam's Bubble Math
or: why her math works perfectly—in a vacuum

Sam walked into my office last Tuesday with that look on her face—the one that says she’s found something again that’ll blow apart whatever I think I know. “From 1995 to 2000,” she said, dropping a chart on my desk, “the NASDAQ grew 10x. Ten times. From 2020 till now? Only 2x.” She leaned back, arms crossed. “You’re always saying we’re in a bubble, but I’m telling you: we’re early. It can still grow much much larger.”
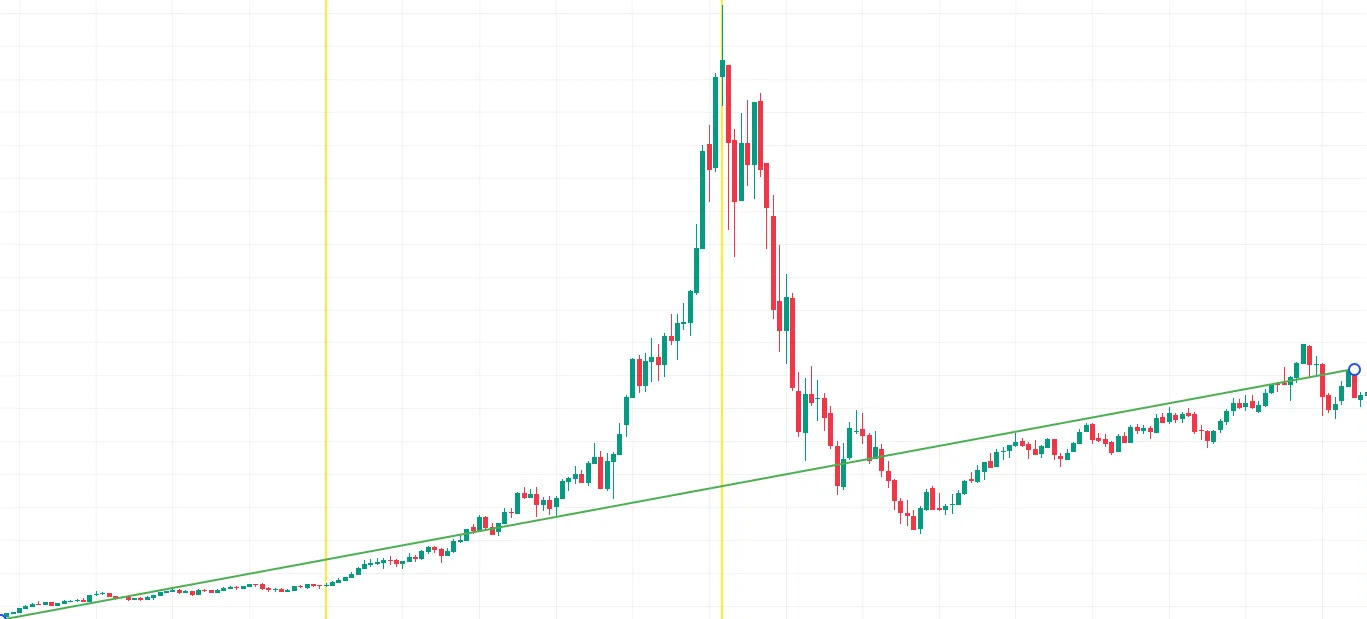
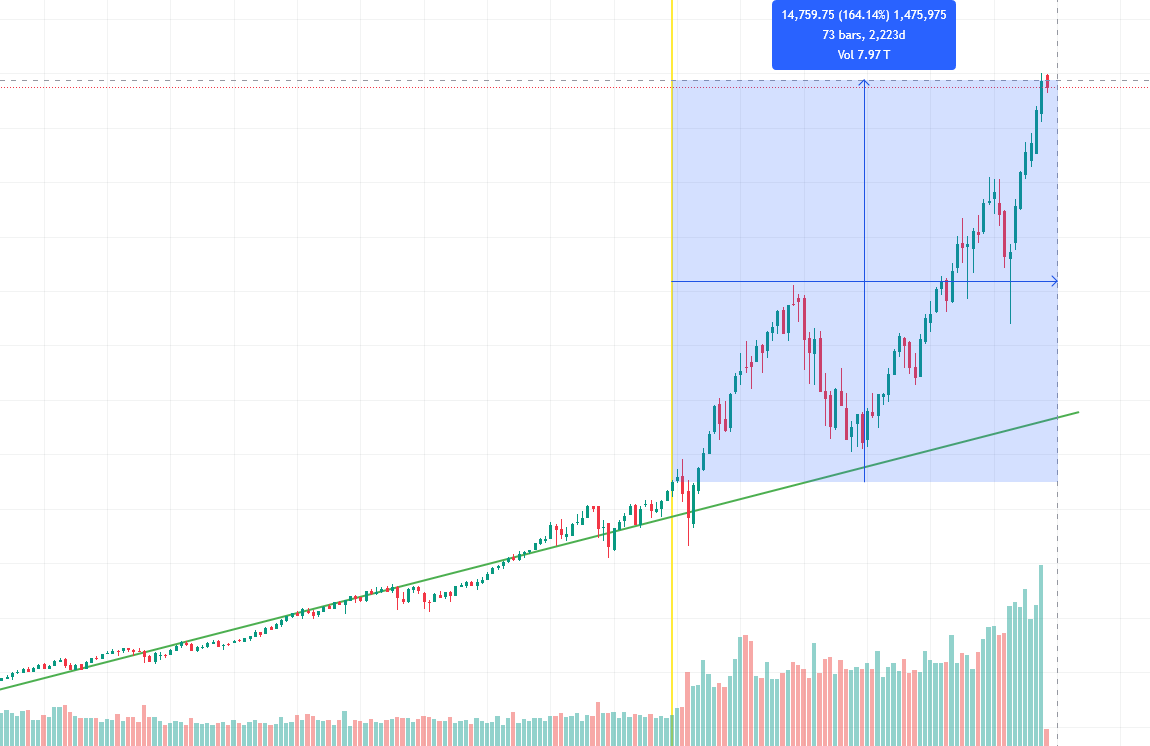
The argument hitted hard, I’ll give her that. At least on the surface. The NASDAQ did indeed rocket 1,168% from January 1995’s level of 398 to that peak of 5,048 on March 10, 2000. Compare that to today’s more modest 164% climb from December 2019’s ~9,000 to roughly 26,000 now, and yeah, it looks like we’ve barely started. Add in her point that Stephen Miran just got confirmed to the Federal Reserve Board—a known dove who dissented at his first FOMC meeting pushing for 50 basis point cuts instead of 25—and you’ve got the makings of a bull case. Easier money, room to run, let’s go.
This also ties into my previous article from August 29:


But here’s what Sam’s missing, and it’s the essential thing that changes just about everything: the debt.
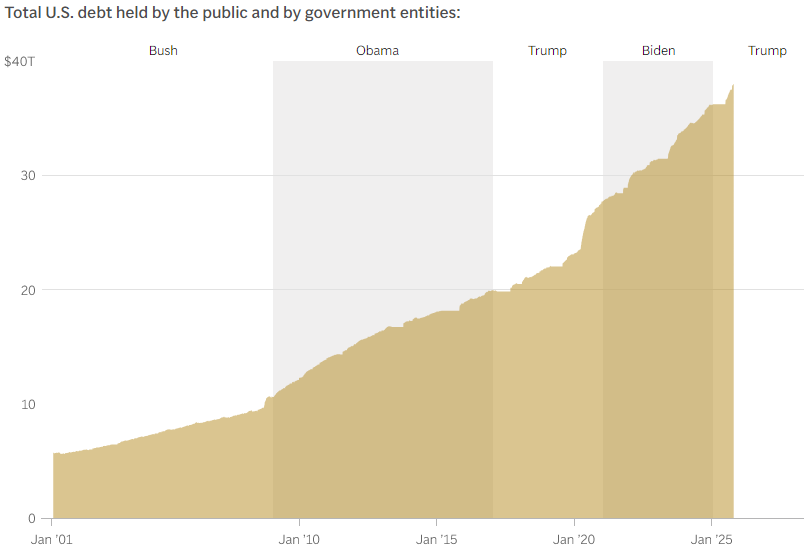
Around the year 2000, total U.S. debt across all sectors sat between 155% and 165% of GDP. Government debt was a comfortable 56-58% of GDP. Household debt? 62%. Corporate debt hovered around 45-50%. The system had room to breathe. More importantly, each dollar of new debt actually produced something—back in the 1960-1998 period, $1 of new debt generated between $1.25 and $3.00 of GDP growth. That’s a functioning economic engine.
Today we’re sitting on over 260% of GDP in total debt. Federal debt alone hit 124% of GDP. Corporate debt surged from that 45-50% range to 73.8% of GDP. In absolute numbers, we went from roughly $5.7 trillion in federal debt to $36.2 trillion—a 535% increase. Corporate debt tripled from $4.5-5 trillion to $22 trillion. Household debt remained stable around 62% of GDP after deleveraging from the 2008 crisis.
You know that debt multiplier? The one I mentioned above, that tells the relation between the amount of economic growth produced versus each borrowed dollar? That has collapsed. Post-1998 figures show each dollar of debt now produces only about $0.75 of GDP. Current estimates put fiscal multipliers between 0.3 and 0.6. That’s a 60-90% decline in productive capacity per dollar borrowed. Research by Nickel and Tudyka found that at approximately 105% debt-to-GDP, the fiscal multiplier turns negative after two years. Below zero. Meaning that any additional borrowing will actually contract the economy.
We’re at 124% government debt-to-GDP. We’re operating somewhere in the zone where new debt does (at best) almost nothing.

Sam also claimed American debt is nothing compared to China’s—”at least three times ours,” she said. I had to stop her there because this one’s just factually wrong. IIF data for Q4 2024 shows China’s total debt at 332.6% of GDP including financial sector, or 290.3% excluding it. The U.S.? 335.0% with financial sector debt, 265.4% without.
We’re basically identical, not three times different.
The composition differs though, and this matters for understanding where the vulnerabilities lie. China’s debt is dominated by corporate obligations at 137.9% of GDP—the highest among major economies. About 79% of that corporate debt is owed by state-owned enterprises, which creates this weird ambiguity about whether it’s actually public or private debt given the implicit government backing. Chinese official government debt sits at 92.3% of GDP, but that excludes the massive Local Government Financing Vehicles carrying another $5.8 trillion in off-balance-sheet liabilities. Include those and China’s government debt rises to 124% of GDP—basically the same as ours.
The U.S. pattern inverts this. Our government debt at 120-124% of GDP dominates the picture, with corporate debt at 74.4% and household at 70.9%. The key point isn’t who has more debt—it’s that both economies are operating near 330-335% total debt-to-GDP, and at these levels, the math just ain’t mathing. Additional borrowing faces sharply diminishing returns regardless of whether you’re in Washington or Beijing.
China’s infrastructure spending illustrates why debt productivity matters more than debt levels. They peaked at 24% of GDP in infrastructure investment back in 2016—an astronomical figure. The Belt and Road Initiative alone provided $331 billion in financing between 2013-2021. Local governments accumulated $7-11 trillion in off-balance-sheet debt financing roads, railways, bridges, ports, airports, power plants, factories. These physical assets carry decades-long useful lives—bridges operate for 50+ years, railways for 30-50 years, factories for 20-40 years.

But here’s the problem: an Oxford study found that over half of China’s infrastructure investments had costs larger than benefits. Nearly two-thirds of projects experienced 40%+ traffic shortfalls versus forecasts. Hundreds of ghost cities, underutilized high-speed rail lines, half-finished projects. They built infrastructure that will physically last for decades but will never generate sufficient returns to service the debt that financed it. That’s what collapsing debt productivity looks like in concrete and steel.
And yes, Sam’s right that Miran’s a dove. But dovish Fed policy only works when you have room to stimulate. When debt’s low, rate cuts juice the economy. People borrow, spend and invest. When debt is already sky-high, rate cuts mostly fund debt service. Federal Reserve research found that monetary policy effects are “less powerful during periods of high household debt.” The transmission breaks down. You’re pushing on a string.
Japan’s been trying this experiment for 30 years. Government debt at 234.9% of GDP, the Bank of Japan owns 46% of government bonds, interest rates at zero or negative since the mid-1990s. Result? Persistently weak growth, chronic deflation, decades of stagnation. The BIS concluded that “monetary transmission is weaker in recoveries from balance sheet recessions” due to debt overhang. When everyone’s already levered up, lower rates don’t create new spending—they just make existing debt cheaper to service.
So yes, Miran can cut rates to zero. But if you’re expecting a 10x NASDAQ rally from monetary easing when the economy’s carrying 100 percentage points more debt relative to GDP than during the dot-com boom, you’re expecting magic that even the Fed doesn’t possess anymore.
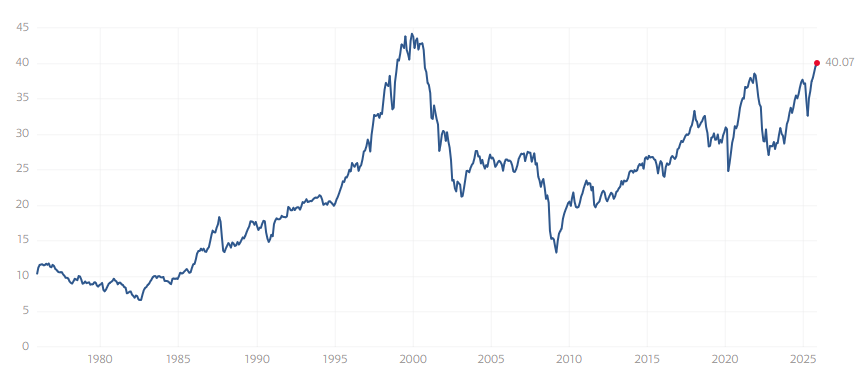
The argument that we’re early in the bubble because NASDAQ’s only up 164% instead of 1,168% falls apart when you look at valuation metrics rather than price appreciation. The Shiller PE ratio currently sits around 40.07, placing it in the 98th percentile of all historical readings. That’s just 10% below the March 2000 peak of 44.2. The historical median is 16.04, meaning we’re trading at 2.5 times the long-term average. Know when it was higher? December 1999. That’s it. Two periods in 150+ years of data: the dot-com bubble peak and right now. We’re 10% below the highest valuation in modern market history.
The CAPE has been above 39 for just 22 months total since 1957—less than 3% of the time. Those periods are 1999-2000 and now. Every prior episode above around 25 ended badly: 1929 preceded the Great Depression, 2000 saw a 60% decline, 2007 dropped 57%. Before the 2008 financial crisis, the Shiller PE only reached 24-27—roughly 40% lower than today.
So yeah, the index hasn’t gone up 10x, but valuations have climbed to within spitting distance of the all-time high. The disconnect between price appreciation and valuation has narrowed to alarming levels.
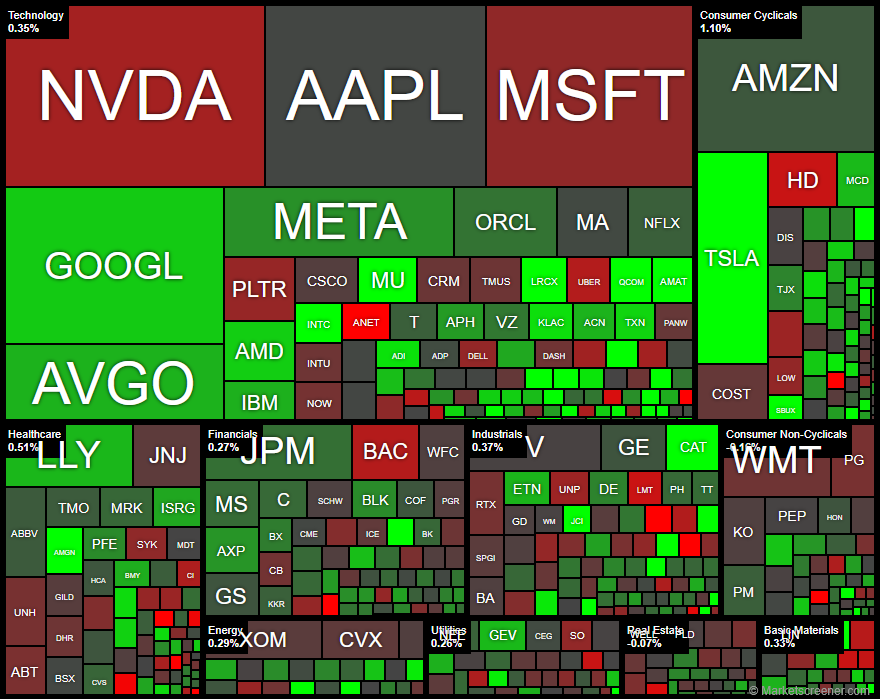
Market concentration has actually exceeded dot-com peaks. The Magnificent 7 stocks now represent 36.6% of the S&P 500’s total market capitalization—that’s about $21.5-22 trillion. At the 2000 peak, the top 10 stocks commanded approximately 27% of the index. The current top 5 stocks alone account for roughly 30% of the S&P 500, compared to 17% at the 2000 peak. Seven companies have greater influence on the index than the bottom 493 combined. The tech sector broadly comprises 49% of the S&P 500, slightly exceeding the 47% reached at the dot-com peak.
But Sam would say: sure, valuations are high, but tech companies today are profitable. Not like 2000 when dot-coms burned cash and had no revenue. She’s right about that. Apple generated $108 billion in free cash flow over the last 12 months. Microsoft, Alphabet, Meta—they’re profit machines. This isn’t Pets.com.
Except look at what they’re doing with that cash.
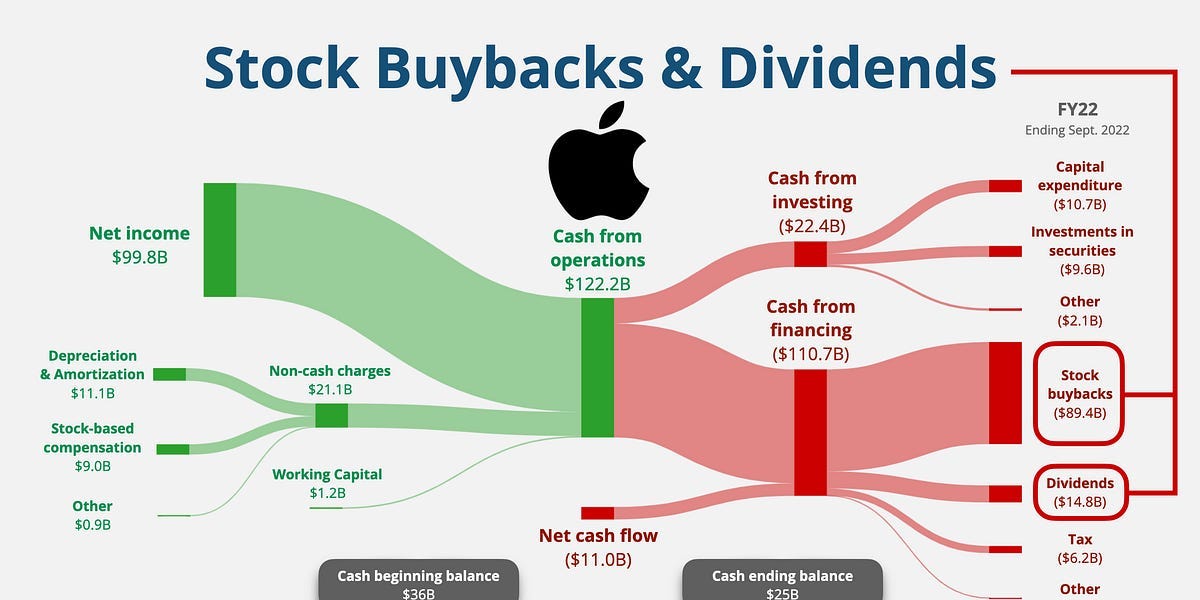
In 2024, S&P 500 companies executed $942.5 billion in stock buybacks—a record. Apple alone bought back $77.9 billion of its own stock, Alphabet $61.8 billion, Meta $29.75 billion. Federal Reserve research confirms nearly 50% of new corporate debt in recent years funded buybacks and dividends, not productive investment. In 2018, 56% of buybacks were debt-financed. I couldn’t find more recent data, but I highly doubt it improved. These companies are borrowing money—adding to that 73.8% corporate debt-to-GDP ratio—to buy their own stock and prop up share prices.
Now contrast that with China. Yeah, China’s got high debt too. But that debt built something. China invested $530 billion annually in transportation infrastructure. Over 40,000 kilometers of high-speed rail between 2008-2023. Manufacturing output went from 9% of global production in 2004 to 30% by 2024. The debt created productive capacity.
US corporate debt? It’s going into financial engineering. Stock buybacks. Dividends. And AI chips.
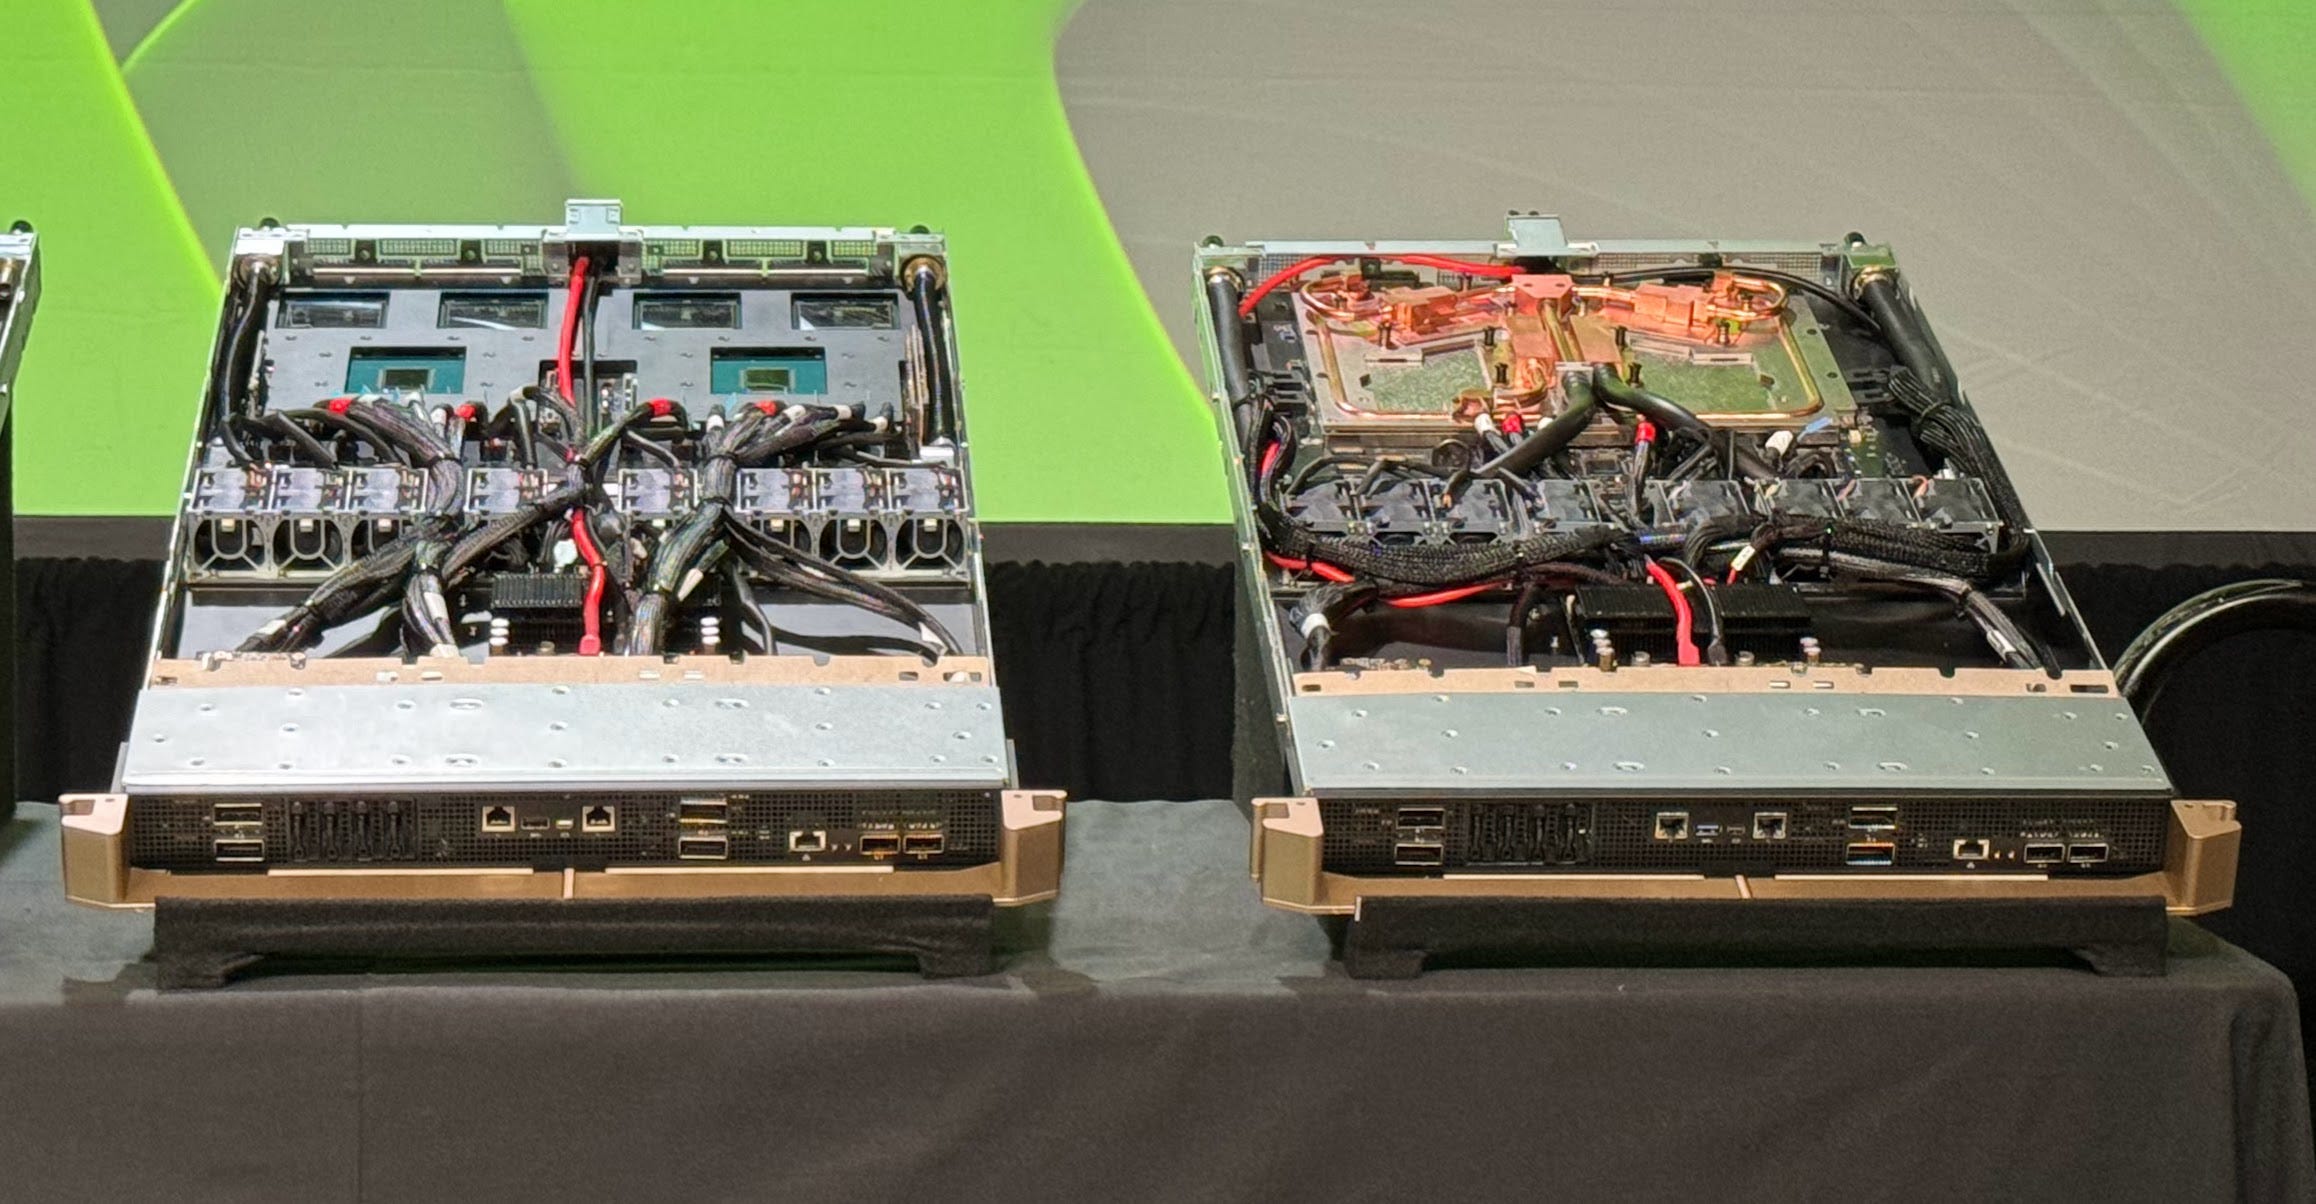
Big Tech spent $180-280 billion on data centers and GPUs in 2024, projected to hit $300+ billion in 2025. Sounds like infrastructure investment, right? Like building capacity? Except GPUs under AI workloads last 1-3 years. Not the 5-6 years they’re depreciated over on company books. Meta’s Llama 3 training showed 30.1% of failures were GPU-related over 54 days. These things run at 700W+, generating extreme thermal stress. Annual failure rates hit 9%, cumulative three-year failure rates approach 27%. They simply physically burn out.
And they’re technologically obsolete even faster. Nvidia moved to annual release cycles. The GB200 “Blackwell” generation provides 4-5x faster inference than the H100. Three-year-old chips become economically worthless even when they still function, because you can’t compete when rivals run hardware that’s 4-5x faster than last year’s hardware. When competitors deploy newer hardware, older chips simply can’t compete on performance-per-watt or performance-per-dollar metrics.
But companies depreciate AI hardware over 5-6 years while actual replacement cycles run 1-3 years. This mismatch understates the true costs by roughly 50%, according to Princeton CITP research. If hyperscalers used 2-year depreciation matching Nvidia’s product cadence, incremental depreciation would consume 7%-22% of 2024 EBITDA. Barclays analysts are cutting earnings forecasts up to 10% for 2025 to reflect more realistic depreciation assumptions.

Compare that to the dot-com infrastructure. $2 trillion in fiber optic cable got laid from 1995-2000. After the crash, 95% sat dark and unused. Companies went bankrupt, bond investors lost 80 cents on the dollar. But those fiber cables had 30+ year physical lifespans. They were technology-agnostic—capable of carrying any signal regardless of future protocols. By 2005-2010, utilization picked up with FiOS, the iPhone, streaming services. By COVID, every strand found use. That infrastructure enabled Amazon, Google, Netflix, cloud computing. Patient capital could wait for demand to catch up because the physical assets didn’t degrade or obsolete.
AI infrastructure requires continuous replacement. It’s not capital investment in the traditional sense—it’s more like operational spending dressed up as capex. And there’s a revenue problem. Sequoia Capital identified a $600 billion gap between AI infrastructure spending and actual AI revenue. OpenAI is at a $3.4 billion run rate. Total AI industry revenue is maybe $10-20 billion. But you need $200+ billion annual revenue to justify current spending. Princeton’s analysis with realistic depreciation suggests a $1.5+ trillion gap.
Industry analysts project an $800 billion annual revenue hole by 2030 if current spending trajectories continue without corresponding monetization. Bain & Company’s analysis suggests this gap grows to $1.5 trillion annually when using true economic cost accounting rather than extended depreciation schedules.
Assume that if Microsoft invests $80 billion in AI infrastructure in 2025, with half being computing hardware carrying a 3-year replacement cycle, true annual replacement cost approaches $13 billion per year. But depreciating over 6 years means only $6.5 billion appears as annual expense, creating a $6.5 billion cushion. This enables subsidized pricing during the critical customer acquisition window—but replacement costs will hit in years 4-5 after customer lock-in is achieved.
This isn’t like China building factories that last 30 years or the telecom companies building fiber optic cable in 2000 that still carries traffic today. The physical assets had genuine long-term utility even when companies failed. What we’re doing is building infrastructure that’s obsolete before the depreciation schedule runs out. GPUs depreciate even faster than cars.

The commercial real estate crisis compounds these pressures in ways that don’t make headlines but matter enormously. The office sector faces severe distress. Office vacancy rates hit 19.6% nationally in Q1 2025—the highest on record—with expectations that rates will peak at approximately 19% by year-end 2025. In major markets, the situation is even worse: Denver reached 26% in Q3 2025, Los Angeles 23.9%, and downtown Seattle an astonishing 35.1%. Office property prices have plummeted 39% from pre-pandemic levels as remote work persists. Delinquencies among large banks reached 11.0% for office loans in Q2 2024, significantly exceeding the 2008-2010 peak of 7.9%. Overall CRE delinquency rates hit 1.42% in Q4 2024, rising from 1.08% a year earlier—the ninth consecutive quarter of deterioration.
But the real issue isn’t what’s already defaulted—it’s what’s coming due. Approximately $1.8 trillion in commercial real estate loans mature by end of 2026, with the maturity wall ultimately peaking in 2027 at $1.26 trillion. 2025 alone sees nearly $1 trillion maturing. Many borrowers face refinancing at interest rates 200+ basis points higher than their original loans. Loans that originated at 2020-2021 rates below 4% now refinance at 6%+. That’s a 50-100% increase in debt service payments when properties are already generating insufficient net operating income due to these vacancy rates.

Many loans from recent years got extended 12-24 months through “extend and pretend,” but that just kicks the can. Banks are running out of extension capacity due to capital constraints. A New York Federal Reserve analysis explicitly warned that “U.S. banks are extending their impaired CRE mortgages to avoid writing off their capital, leading to credit misallocation and a buildup of financial fragility.”
44% of those loans are in negative equity—property worth less than the outstanding loan. Regional banks are most exposed. Dime Community Bank shows a 602% CRE-to-equity ratio, Eaglebank 571%. 59 of the 158 largest banks have CRE exposures exceeding 300% of total equity capital. Small banks under $10 billion in assets hold 48.2% of total loans in CRE with an average 366.4% CRE-to-capital ratio.
The commercial real estate loan market totals approximately $5.9 trillion, with banks holding roughly $3.0 trillion. CRE loans now represent 23% of total bank loan portfolios. Regional and community banks collectively hold 66% of all CRE loans despite representing a smaller share of total banking assets. Approximately 530 banks exceeded regulatory concentration thresholds as of December 2023, with 1,374 banks (31% of all institutions) classified as CRE-concentrated.
This is a slow-motion crisis, not the same as 2008’s sudden collapse—more like the 1980s-90s S&L crisis that ground on for years. But if recession hits during the current refinancing wave through 2026-2027, amplification into a broader crisis becomes likely.
And banks have another problem.
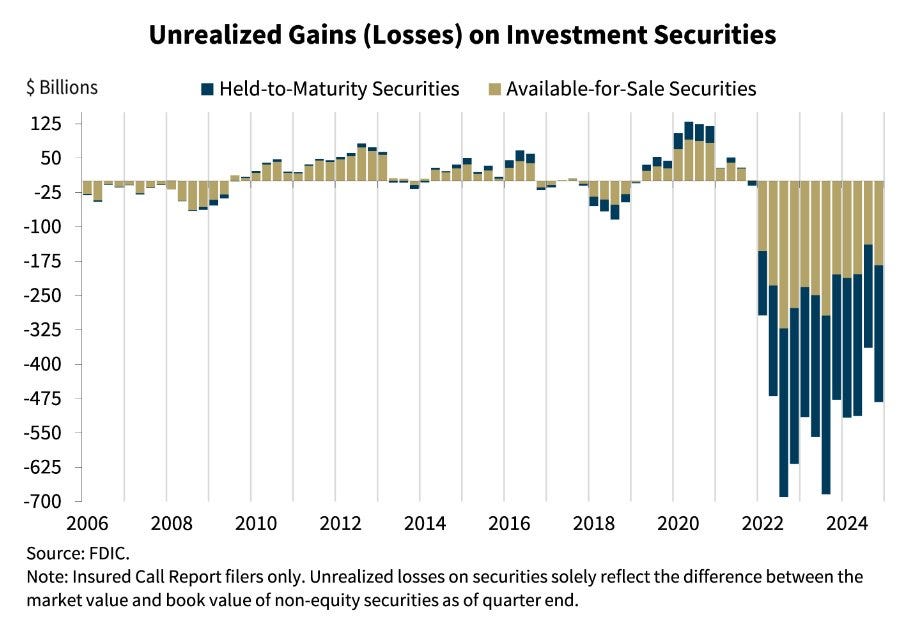
US banks held $413.2 billion in unrealized losses on securities as of Q1 2025 according to FDIC data—down from a volatile Q4 2024 figure of $482 billion, which itself surged from $364 billion in Q3 2024. The fluctuations reflect the extreme sensitivity to interest rate movements. These losses remain 4-7 times higher than the roughly $100 billion in unrealized losses during 2008. These losses represent approximately 8.6% of the fair value of aggregate securities holdings and 19.9% of aggregate equity at banking subsidiaries. These losses stem from the Fed’s rapid rate increases starting March 2022—from 0.25% to 5.50% by July 2023, while 10-year Treasury yields rose from 1.5% to peak near 4.8%.
Banks bought $2.3 trillion in securities during 2020-2021 when rates were near zero, loading up on long-duration Treasuries and mortgage-backed securities yielding 1-3%. When rates spiked to 5%+, those securities lost 20-30% of value.
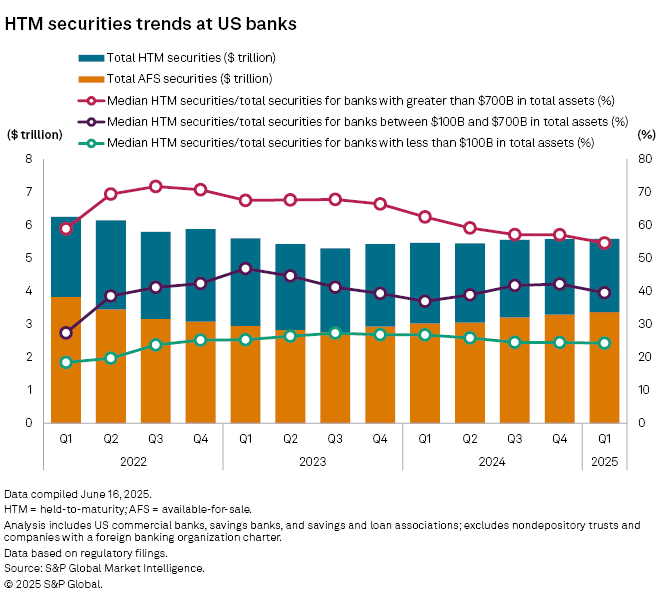
Bank of America holds $96.35 billion in held-to-maturity unrealized losses as of March 31, 2025. Wells Fargo $37.82 billion, JPMorgan Chase $22.91 billion, Citigroup $15.2 billion. The big four combined carry $172.28 billion. The breakdown shows approximately $305 billion in unrealized losses on held-to-maturity securities and $177 billion on available-for-sale securities.
But I’m going to let you in on a nasty trick they’re playing: they classify these securities either as Available-for-Sale or Held-to-Maturity. AFS securities report at fair value with losses hitting equity. HTM securities report at amortized cost with losses only disclosed in footnotes—they don’t hit the balance sheet or income statement unless sold. In 2015, Basel III let banks under $250 billion opt out of including unrealized losses in regulatory capital calculations.
99% opted out.
During 2021-2022, banks shifted $1.7 trillion from AFS to HTM classification to avoid recognizing losses. This allowed banks to “minimize interest rate risk concerns rather than taking remediating actions sooner,” according to Kansas City Fed analysis. Or said otherwise: cheat on their tax sheet. You know, what you and I would go to prison for?
This is what killed Silicon Valley Bank on March 10, 2023—the second-largest bank failure in U.S. history with $209 billion in assets. SVB held $91 billion in HTM securities with $15 billion in unrealized losses—90% of total equity—plus $26 billion in AFS securities with $2.5 billion in unrealized losses. The bank announced a $1.8 billion loss on a securities sale March 8, triggering a bank run that consumed the institution within 48 hours. $42 billion withdrawn in 24 hours—the fastest in history, accelerated by social media and digital banking. A staggering 94% of deposits were uninsured, which accelerated withdrawal velocity. Signature Bank failed March 12, First Republic on May 1. Combined cost to the Deposit Insurance Fund: $22.5 billion.
Florida Atlantic University identified 34 banks with over $1 billion in assets reporting unrealized losses equal to or exceeding 50% of Common Equity Tier 1 Capital as of Q4 2024, up from 12 banks in Q3 2024. The vulnerability is still there, just hidden in HTM classifications and footnote disclosures.
The risk differs from 2008 in nature but not magnitude. 2008 involved credit risk—subprime mortgages that would never be repaid, creating counterparty uncertainty. Current unrealized losses involve high-quality assets that will pay at maturity—losses only materialize if banks are forced to sell. But the absolute magnitude is 4-7x larger, and modern bank runs occur at unprecedented speed.
Combined with CRE exposure, this creates dual pressure on the banking system through the remainder of 2025 and into 2026-2027. Regional banks with 300%+ CRE-to-capital ratios also carry unrealized securities losses. If recession hits, loan losses mount, deposits flee, banks are forced to sell securities, and unrealized losses become realized. The accounting treatment has made the system more fragile, not less. As of Q4 2024, 66 banks appear on the FDIC’s confidential problem bank list, up from 52 a year earlier.

The government shutdown introduces a timing risk that compounds these existing vulnerabilities. Banks navigating the 2025-2026 CRE refinancing wave need stable deposit bases to extend maturities and avoid forced asset sales. But shutdown-driven deposit withdrawals—as households tap savings for basic expenses—arrive precisely when banks need liquidity most. This creates a forced seller dynamic absent from previous shutdowns: banks must choose between booking losses on securities sales to meet withdrawals or denying CRE loan extensions that would otherwise be routine. Either choice accelerates the recognition of losses they’ve successfully deferred through accounting classifications. The concentration of risk in regional institutions means contagion spreads through correspondent banking relationships faster than regulatory intervention can contain it.

With all this background, let’s get back to Sam’s question: Can markets go up another 10x like they did from 1995 to 2000?
I strongly argue: no.
Not even close.
In 1995-2000, you had declining government debt ratios, total debt at ~175% of GDP, no significant prior leverage to work through, effective monetary policy transmission, retail-driven speculation that could burn itself out gradually, and durable infrastructure investment that created long-term value. The cleanup after 2000 was painful but manageable. Write off the worthless dot-coms, the fiber stays, patient capital waits, and a decade later the infrastructure powers the next boom.
Today you’ve got federal debt at ~125% of GDP, total debt at ~270%, corporate debt funding buybacks instead of innovation, AI infrastructure with 2 year lifespans requiring continuous replacement, institutional dominance that accelerates capital flight, the highest market concentration in 145 years, $413 billion in bank unrealized securities losses (volatile and interest-rate sensitive), approximately $1.8 trillion in CRE loans maturing by end of 2026 with the peak hitting $1.26 trillion in 2027, and monetary policy that’s exhausted its effectiveness because everyone’s already levered to the gills.
You can’t run the same play when the field conditions are completely different. Sam’s looking at NASDAQ multipliers and seeing patterns. But she’s missing the foundation underneath.
In 1995, the foundation was solid.
In 2025, it’s cracked, waterlogged, and we’re building higher anyway.
Yes, Miran can cut rates. Markets might rally. Hell, they might even make new highs—momentum and narrative can persist longer than fundamentals justify, especially with institutional flows and buyback programs providing continuous buying pressure. Maybe we squeeze another 20-30% out of this before something breaks. But 10x? Another 1,168% multiplier like 1995-2000?
You’d need the debt load to be 50% lower, the Fed to have actual policy space, companies to deploy capital into productive investments instead of buybacks, AI infrastructure to prove it generates the $600 billion in missing revenue, banks to resolve $413 billion in securities losses without forced sales, CRE to refinance $1.8 trillion through 2026 and the $1.26 trillion peak in 2027 at higher rates without cascading defaults, and market concentration to decline so seven companies aren’t holding up the entire index.
Spoiler alert: Not gonna happen!
The debt multiplier’s broken. Each dollar of stimulus, each rate cut, each buyback generates less real economic activity than it did in the 1990s. We’re not early in the bubble—we’re late. The Shiller PE at 40 is screaming that. The market concentration is screaming fact of that. The CRE delinquencies exceeding 2008 levels are screaming that.
Sam’s math could work in a vacuum.
If you just look at NASDAQ multipliers across time and assume repeating patterns, sure, we’re only 164% up, plenty of room to 1,168%.
But markets don’t exist in a vacuum.
They exist on top of an economic system. And our economic system is carrying structural loads it was never designed to bear. The frame’s bent, the foundation’s settling unevenly, and we’re arguing about how many more floors we can add.
The answer? Not many!
Maybe Sam gets her wish and a dovish Fed policy pushes us higher for another year or two. But the 10x dream? That requires a different economy than the one we’ve actually built.
The current structure doesn’t face the panic liquidation risk that crashed NASDAQ by 78% after March 2000. Corporations won’t get margin calls forcing asset sales. But they will eventually curtail investment when returns disappoint.
The constraint isn’t psychology this time.
It’s simple mathematics.
There will be a time when general market gains made over several years will evaporate in a few months, rewarding those traders bold enough to time their shorts and make a lot of money quickly. I don't see a highly profitable big short in a short time span any time soon, though. Yet an adverse catalyst of events is converging, pointing to a time of reckoning: the overexuberance we see in today's markets. May providence lead us to patience and good timing.
Excellent report, NO1.