
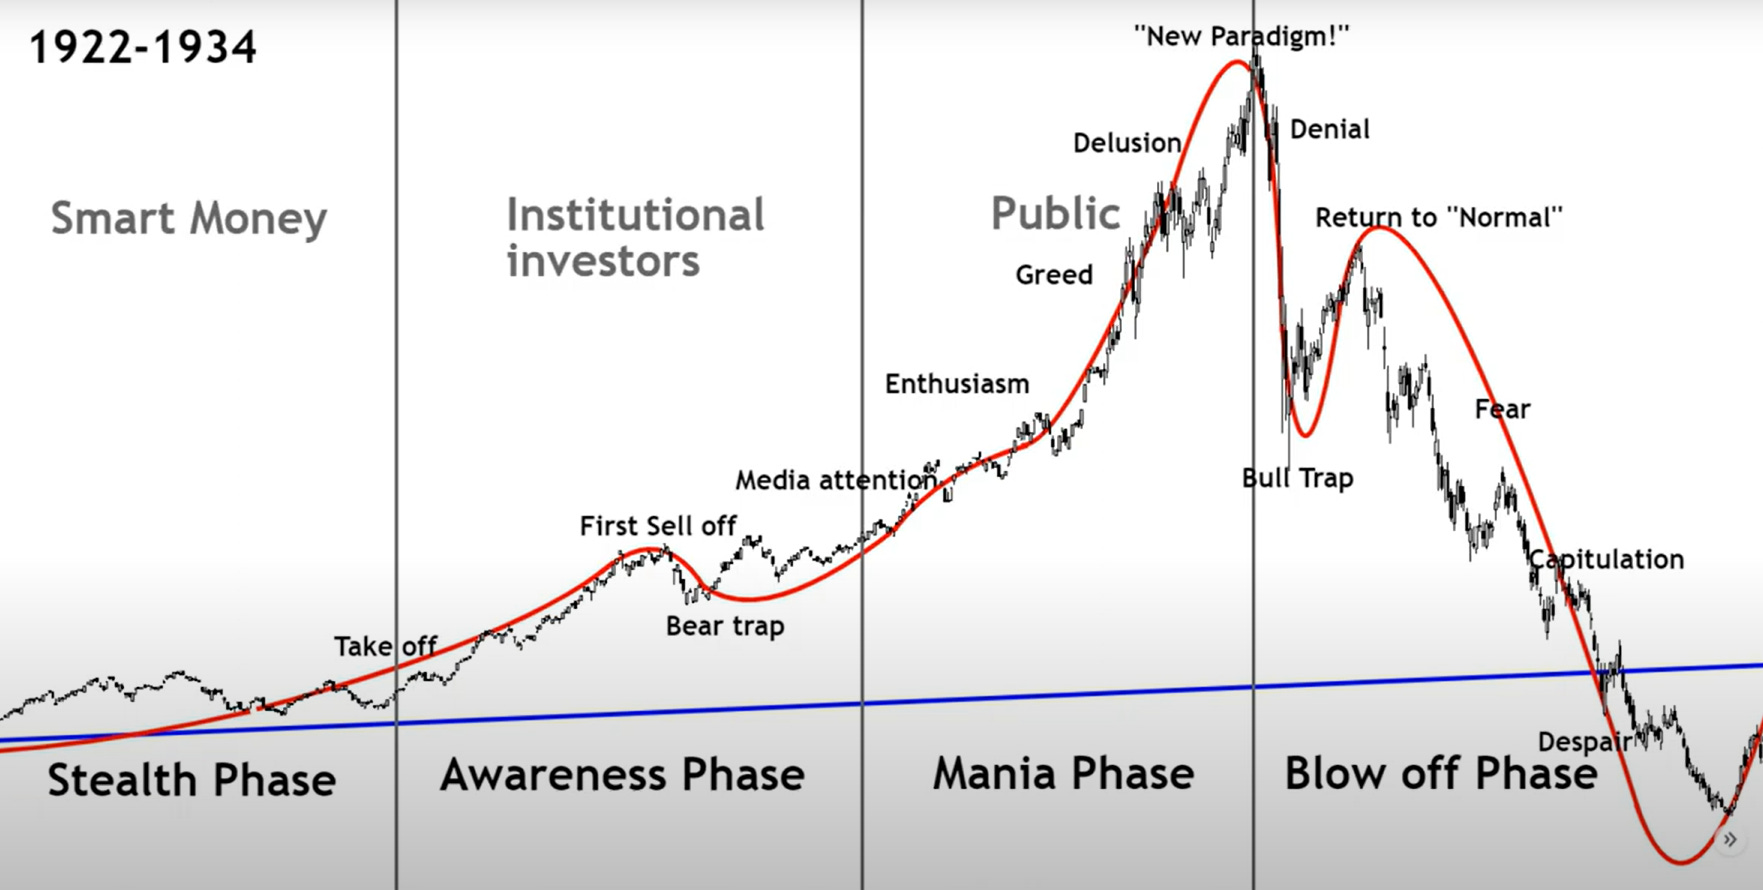
The dynamics of a bubble

Every financial bubble follows a remarkably similar pattern, a choreography of greed and fear that repeats across centuries and asset classes. The beginning is deceptively quiet - prices creep higher slowly, barely noticed by mainstream investors. Early adopters accumulate positions while most market participants remain skeptical or unaware. Then comes the bear trap, a sharp selloff that appears to confirm the skeptics' doubts. This decline shakes out weak hands and early speculators who bought on margin or with conviction too shallow to weather volatility.
What happens next transforms a simple rally into a bubble. The recovery from the bear trap accelerates beyond all reasonable expectations. Prices don't just recover; they explode higher, drawing massive media attention and public participation. This parabolic rise creates its own momentum as fear of missing out overwhelms rational analysis. After reaching a spectacular peak, prices suffer a notable correction - not the final crash, but enough to test conviction. True believers interpret this as healthy consolidation, a chance to buy the dip before the next leg higher. The subsequent rally never quite matches the initial fervor. Prices recover but struggle to reach new highs, trading volumes thin, and the smart money begins rotating out quietly (bull trap). This distribution phase can last weeks or months, lulling participants into believing normalcy has returned.
I won't dig further into this pattern here, but rather concentrate on what happens during the crash itself. When the real collapse arrives, it strikes with devastating speed and catches most participants completely unprepared.
During a panic, you sell what you can, not what you want.
The mechanics of a crash reveal a brutal truth about markets: during panic, you sell what you can, not what you want. This principle explains why high-quality assets often suffer the worst initial declines. Blue-chip stocks and precious metals plummet not because their fundamentals have deteriorated, but because they represent the only liquid positions in hemorrhaging portfolios. A fund manager facing redemptions cannot wait for their private equity positions or thinly-traded small caps to find buyers - they must raise cash immediately by dumping their most marketable holdings.
Gold and silver exemplify this paradox perfectly. Despite their reputation as safe havens, precious metals routinely crater during the initial stages of a crisis. Investors desperate for liquidity to meet margin calls or cover losses elsewhere have no choice but to liquidate their metal positions at whatever price the market offers. Yet once this forced selling exhausts itself, precious metals typically stage dramatic V-shaped recoveries as their fundamental appeal reasserts itself and bargain hunters recognize the disconnect between price and value.
Margin calls accelerate every crash into a self-reinforcing spiral. When an investor borrows money to buy assets, they must maintain a minimum equity cushion in their account. As prices fall, this cushion shrinks, triggering demands from brokers for additional capital. Those unable to deposit more funds face automatic liquidation of their positions, pushing prices lower and triggering more margin calls in a cascading chain reaction. The speed and violence of margin-driven selling often overwhelm any attempt at orderly price discovery.
Ultra-low interest rates act as gasoline poured on this combustible mixture. When borrowing costs approach zero, the temptation to leverage investments becomes irresistible. Why settle for modest returns on your own capital when you can borrow cheaply and multiply your gains? This logic works magnificently during the bubble's expansion phase, transforming ordinary returns into spectacular windfalls. The mathematics reverse viciously during the contraction - leveraged losses compound just as dramatically as leveraged gains, wiping out overleveraged investors in days or hours rather than months or years.
The market can remain irrational longer than you can remain solvent.
Central banks inadvertently feed this cycle through their monetary policies. By suppressing interest rates to stimulate economic growth, they push investors into increasingly risky assets in search of yield. Retirees who once lived comfortably on bond income find themselves buying dividend stocks, while traditionally conservative investors venture into real estate speculation or cryptocurrency. Each participant moves one step further out on the risk curve than they would in a normal rate environment, creating systemic fragility that only becomes apparent when the bubble bursts.
The aftermath of every bubble follows its own painful logic. Assets that fell hardest during the panic often recover fastest once stability returns. Correlation breaks down as fundamental value reasserts itself over forced liquidation. Those with dry powder and strong nerves find extraordinary opportunities among the wreckage, while overleveraged participants nurse wounds that may take years to heal. The cycle then begins anew, as memories fade and a new generation discovers the intoxicating allure of easy money, setting the stage for the next bubble to form.
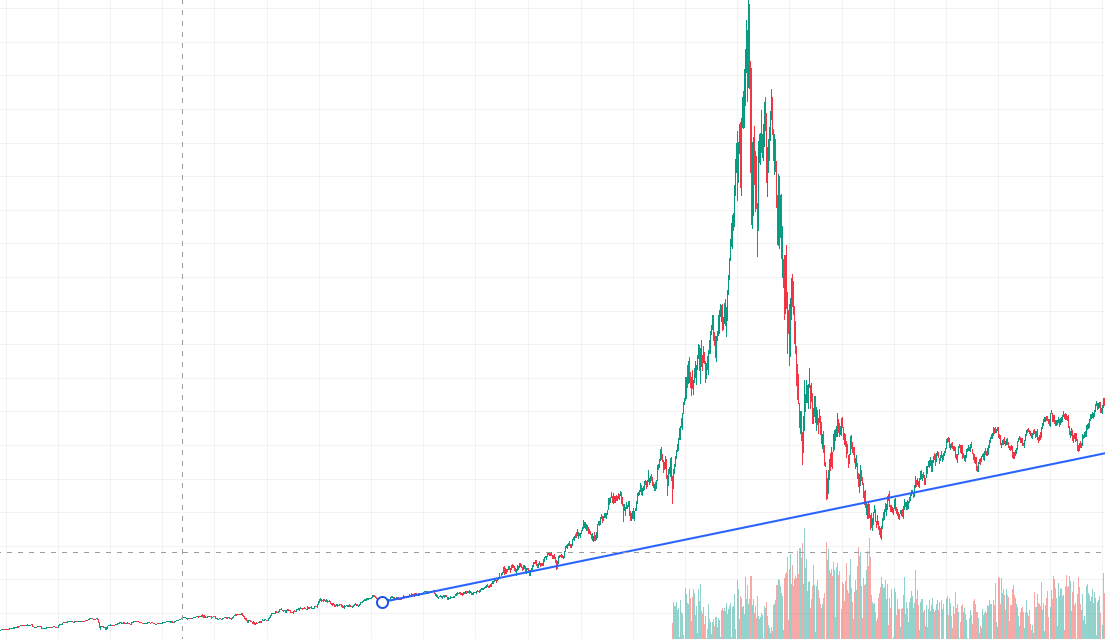
Y2K: You clearly see the bull trap here.
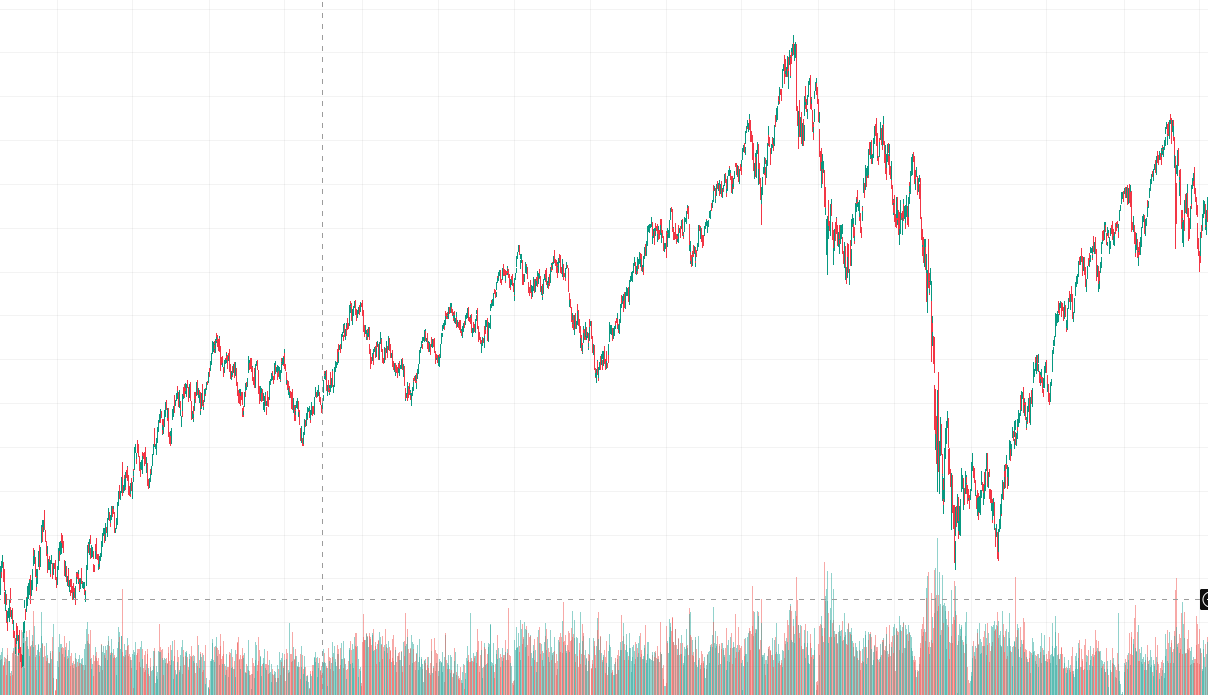
2008: not so clear bubble pattern, as we papered that completely over, so we got the V-shaped recovery of just about everything:
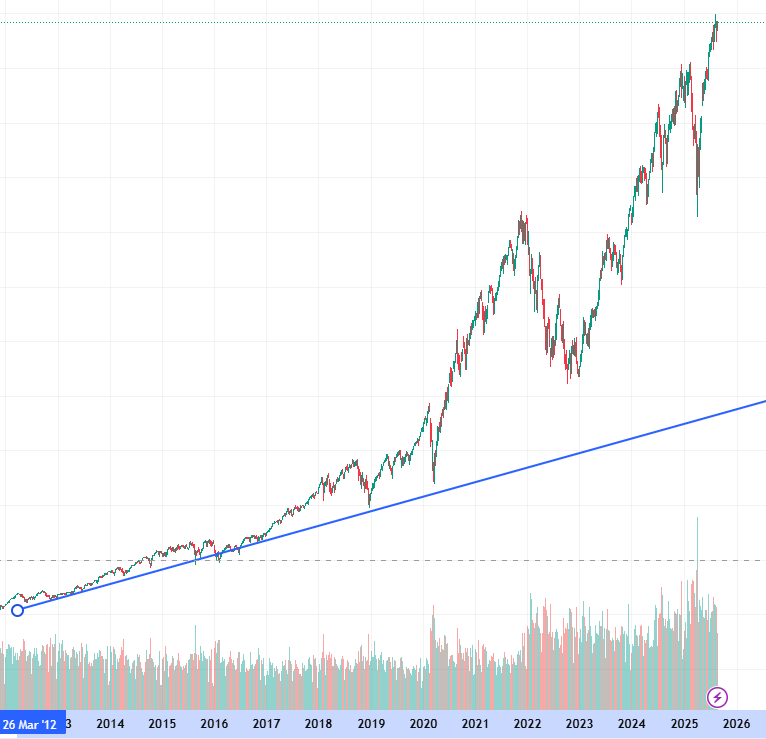
2010-2025: We got the bear trap with COVID, but are we just starting the manic phase, or is it topping?
Update - more detailed explanation by FxBrawler on YouTube:
Great stuff. Could you point out a more detailed explanation of the patterns of bubbles, NO1?
It kind of felt like a trazer there at the middle 😉😁