
Length, not temperature
This is not the economy you're looking for

After my last piece on the DXY, Greg left a comment:
Question then - will future post explore what Fed’s indices are saying about the dollar? Any interesting correlations to gold / silver?
Two questions. One thread. Let me pull on it.
In that previous article “The dollar index is lying to you” I went after the DXY. A frozen basket, weighted by 1973 trade patterns, completely missing China and Mexico, basically only useful as a proxy for EUR/USD. My conclusion was simple enough:
The math is perfect. The inputs are just garbage.
So back to your question Greg. The narrow reading is: has the Fed a better index? Answer: Yes. They do.
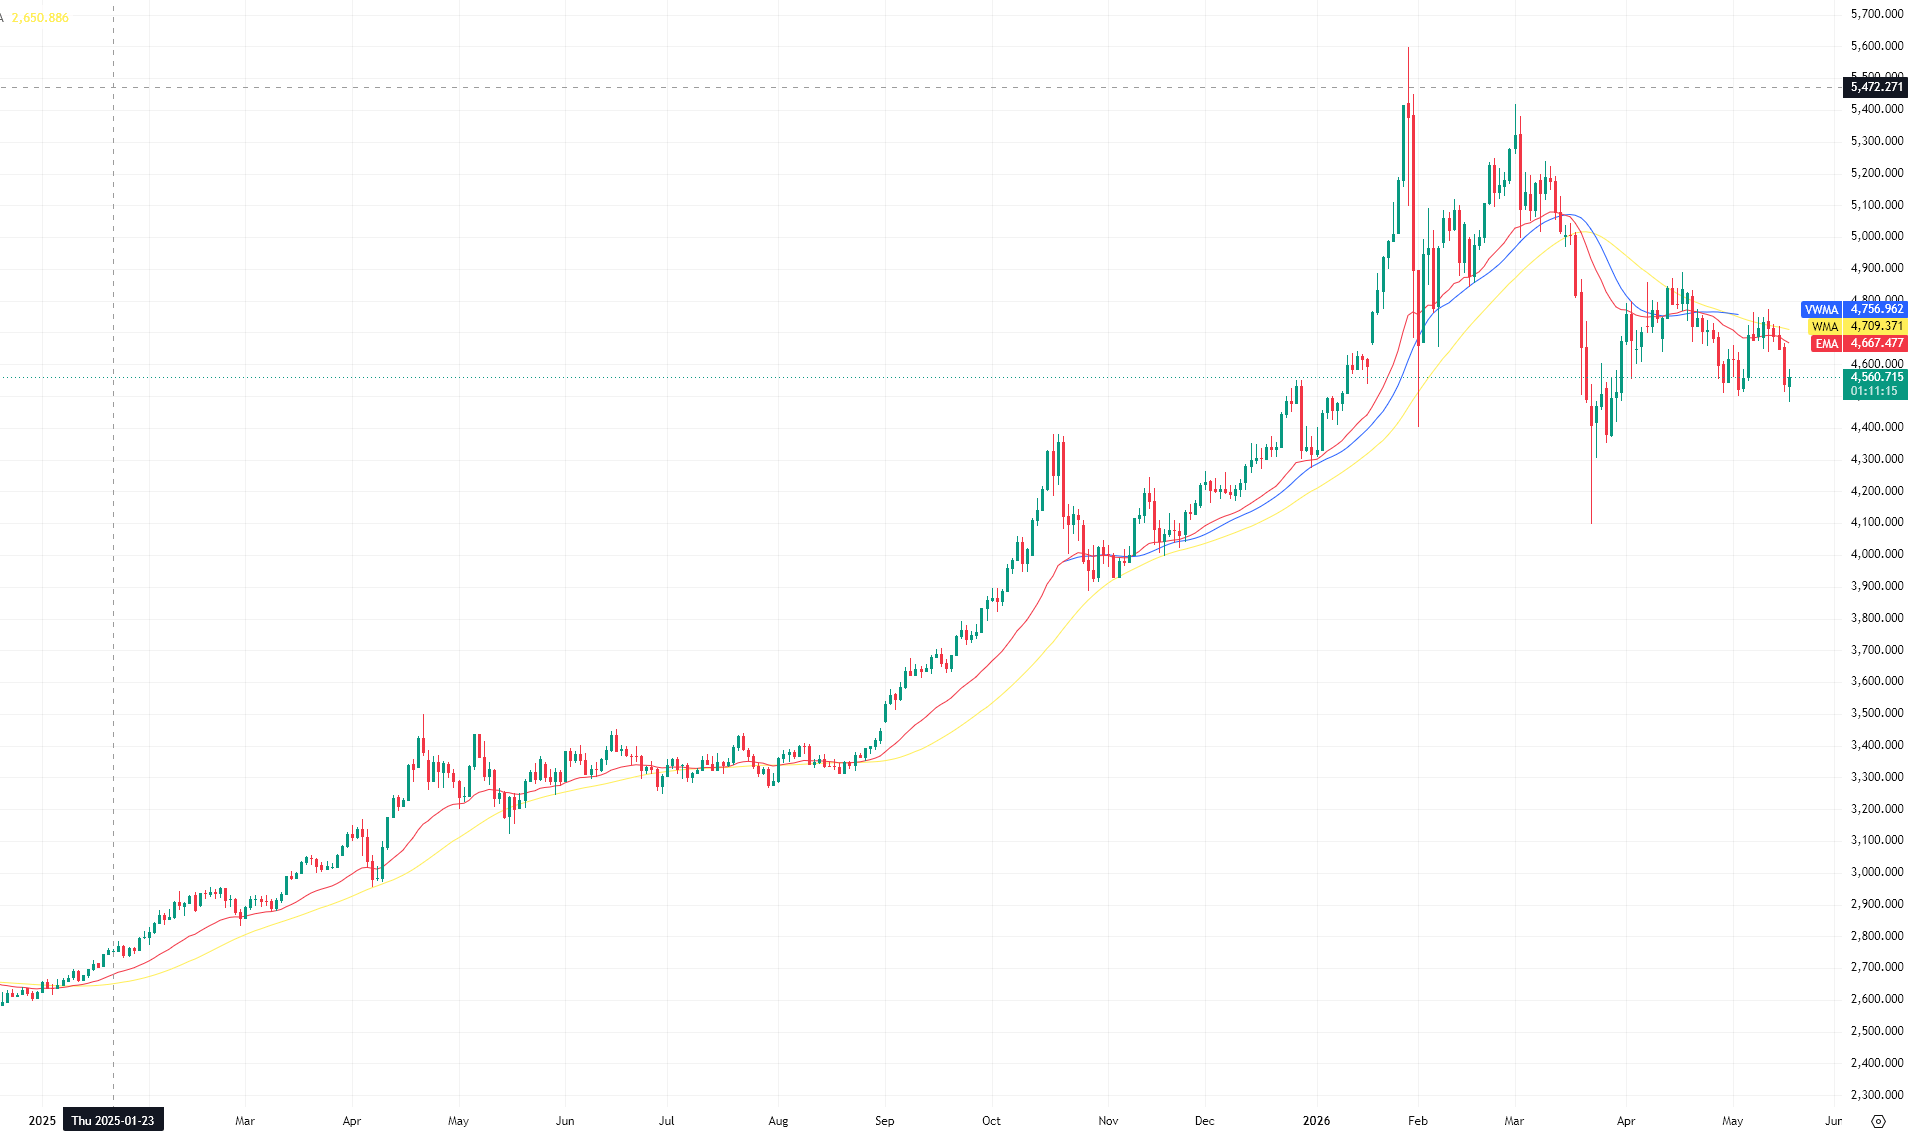
The Fed’s Nominal Broad Dollar Index (DTWEXBGS, if you want to type it into FRED) sits at 118.4 as I write this. It peaked at ~130 in January 2025. That’s a 9% decline from the high. The inflation-adjusted version dropped about 6.5% in 2025.
The calculations are at least better than the DXY. China’s share is at 11%. Mexico’s at 14%. Goods and services trade change. At least this one is rebalanced every year against actual trade flows.
So yes, this one’s better. A similar story as the DXY, just more honestly. The dollar weakened. It’s a bit less dramatic, because once you include the yuan (which Beijing actively manages against the dollar), the moves flatten.
But.
Gold did 65% last year. Silver did 150%. A 7% trade-weighted decline and a 65% move in gold do not sit on the same chart. They are not measuring the same thing. The Fed’s better dollar index isn’t the answer to the question either.
So… Allow me to expand the surface area. Because I think what you were aiming for is:
when the Fed publishes data - any of it - what are they actually measuring? And why doesn’t gold seem to care?
If that’s what you were aiming for… Well… then we’re cooking.
The Fed publishes a lot of numbers. The trade-weighted indices we just covered. M2 money supply. The balance sheet. “Real” GDP. “Real” yields. “Real” wages. Productivity. Industrial production. The breakeven inflation curve. Foreign Treasury holdings. Bilateral exchange rates, daily. And on and on and on …
Each one is a different ruler measuring a different thing.
And almost every one of them depends on the same upstream input: CPI.
You cannot talk about the “real” anything in macroeconomics without subtracting inflation. “Real” GDP is nominal GDP minus inflation. “Real” yields are nominal yields minus inflation. “Real” wages, nominal wages minus transportation. Nah, I’m kidding. Minus inflation of course.
Productivity uses real output. Social Security cost-of-living adjustments are CPI-indexed. TIPS principal adjusts to CPI. The Fed’s reaction function, the dot plot, the entire framework of “are we hitting our 2% target” - all CPI.
CPI is the keystone. Pull it out and the arch falls.
So if CPI is wrong - even slightly - every “real” number downstream is wrong in the same direction.
I touched on this in “They’re Not Even Trying Anymore”. Their methodology changed about a dozen times since 1980. Food and energy were excluded from the “core”. Who needs that, right?
But let me actually dig in this CPI for once, because this cornerstone deserves some attention.
Take owners’ equivalent rent. About a third of the CPI basket.
It measures housing costs not by tracking what people actually pay - mortgages, taxes, insurance, maintenance - but by asking homeowners what they think they could rent their own house for.
I’m not making that up!!
A government survey calls homeowners and asks them to imagine being their own landlord. Their answer becomes a third of the inflation measure that anchors monetary policy for the largest economy on Earth.
When mortgages doubled in 2022-2023, official housing inflation barely moved. Because what changed was the cost of buying a house. Not the imaginary rent a homeowner imagines charging themselves.
Try explaining that one to anyone who actually pays a mortgage.
Hedonic adjustments are another classic. The theory says quality improvements should be subtracted from price increases. A car that costs $5,000 more than last year’s model but has better airbags hasn’t really gotten more expensive, because you’re getting more car. Same dollars, more value. CPI says: inflation neutral.
A television that costs the same but has a bigger screen has gotten cheaper. CPI says: deflationary.
Apply this aggressively enough and you can keep CPI low forever, no matter what prices do. Cars cost more? Better airbags. Houses cost more? Better insulation. Healthcare costs more? Better outcomes, allegedly. Everything always has more features, so everything is always, in a strict statistical sense, getting cheaper. Even as your bank account begs to differ.
Substitution is the third leg. The theory: when steak gets expensive, you switch to chicken, so your effective inflation is lower than the price of steak suggests. CPI builds this into the model. Translation: when you get poorer and downgrade your consumption, that doesn’t count as inflation. That counts as a successful substitution.
I keep waiting for someone to ask whether they’re measuring inflation or measuring downgrade…

There’s this guy named John Williams. You may not know him, but when I tell you he’s the one running “ShadowStats”, I’m sure that rings a bell. He’s a retired economist and he single-handedly calculates this shadow-CPI for the past 20 years.
His methodology rolls back the various adjustments and computes CPI the way it was done in 1980, or 1990 (he has 2 calculations), before each round of revision.
Most years, his numbers run roughly 5-7 percentage points above official CPI.
But don’t take ShadowStats as gospel. It’s not that this “1980 methodology” is automatically right either. But at least I feel he’s making an honest attempt to keep a consistent measurement over time, and the gap between his number and the official one tracks pretty cleanly with what regular people experience walking into a grocery store, a doctor’s office, or a rental agreement.
Now apply this downstream.
“Real” GDP. Calculated as nominal GDP minus a price deflator that’s a close cousin of CPI. Understate the deflator by 5 points, overstate growth by 5 points. The American economy hasn’t been growing at 2-3% for the last twenty years. By honest accounting, it’s been roughly flat. Maybe contracting.
“Real” wages… CPI understates them by 5 points, and when your wages go up 3%, you didn’t really get a 1% raise. Instead, you took a ~4% real cut. Which matches what you feel in your wallet. No matter what the BLS’s numbers say.
Productivity. Output per hour, where output is “real” output. The American productivity miracle of the last two decades dissolves entirely the moment you use an honest deflator. Most of it was hedonic adjustments doing the heavy lifting. Statistically probably accurate... But reality wants a word.
“Real” yields. The yield on a Treasury bond minus inflation. By official numbers, real yields are positive and have been for about two years now. The 10-year TIPS yield sits around 2%. Textbook macro says positive real yields are kryptonite for gold. Who holds a non-yielding metal when bonds pay you a real return?
So gold should be getting destroyed.
Gold did 65% last year. The textbook says that’s impossible in a positive-real-yields environment. The macro framework that worked from 2003 to 2022 says gold and real yields move inversely. Correlation around -0.85 for two decades. Beautifully clean.
Then it “broke” in 2022.
Curious how that goes…
You can find really a lot of articles about this! Major banks. Financial press. Fed research papers. All Very Important People. All noting the curious decoupling.
Lots of explanations. Central bank buying. Geopolitical premium. De-dollarization. Structural demand from BRICS.
All real. And it all matters.
But nobody seems to ask the much simpler question:
Real yields equal nominal yields minus inflation.
What if the inflation number going into that subtraction is wrong?
Take the 10-year Treasury yield (around 4.3%). Subtract honest inflation (call it 8% based on what people actually pay for housing, healthcare, insurance, food). You get a real yield of -3.7%.
Deeply negative.
Which is the environment that produces, historically, every gold bull market in the modern era.
The correlation didn’t break. It works perfectly. Gold has been responding to real real yields the whole time. The chart only looks broken because the published real yield uses fake inflation.
This isn’t subtle. It isn’t even a fringe interpretation. Thousands of economists with PhDs are staring at this chart, going “huh, weird”, and writing think pieces about structural BRICS demand, while the bent ruler sits in plain view on the desk in front of them.
Garbage in. Garbage out.
Same diagnosis as the DXY. Different ruler. Same disease.
This is why gold doesn’t correlate cleanly with any single Fed metric anymore. The metrics are broken collectively, in coordinated fashion, by the same upstream lie. Every ruler in the building has been bent. Just enough. In the same direction.
But even an imperfect ruler measures just length. It doesn’t measure temperature.
— No1
What’s happening in gold and silver is closer to temperature. It’s a reading of how hot the underlying monetary fire is burning, regardless of what the rigged thermometers in the lobby say.
Central banks know this.
They’ve been buying gold at a record pace they haven’t shown since the 1960s. The Chinese know it. The Russians experienced it the hard way in 2022.
There’s another -third- reading of the question that I haven’t touched.
Not “what are the Fed indices saying” and not “what is every Fed measurement of the economy saying”.
The third reading is: what is the Fed institutionally communicating about the dollar - through statements, dot plots, FOMC minutes, the rebranded purchases I covered briefly in “So long, farewell, Auf Wiedersehen, goodbye” (they call it “reserve management” because saying QE5 out loud would scare people).
But the answer to the first two questions, taken seriously, is the same answer:
The Fed publishes rulers for the economy that fits the narrative.
Gold prices the economy that exists.
And those two… are not the same economy.
Well, I am honored and humbled… thank for taking the question and running with the extensions to the questions I did not know to ask!
Super helpful to have a clearer picture of what is obviously being manipulated, and how! You have a unique ability to get to the heart of the matter and style to present in an easy to understand, and often humorous manner. I always learn something from your posts. Your efforts and skills are much appreciated!
"There are three kinds of lies: lies, damned lies, and statistics." - Mark Twain
Outstanding article, thank you. You said, “ then it broke in 2022”. Was the seizure of Russian central bank funds that year was what “broke”?