
Weekend thoughts
No penny for my thoughts

This is a weekly digest of unassociated pictures (graphs mostly) I saw during the week. Not much context is given.
For daily digests: https://no1sdailydigest.substack.com/archive
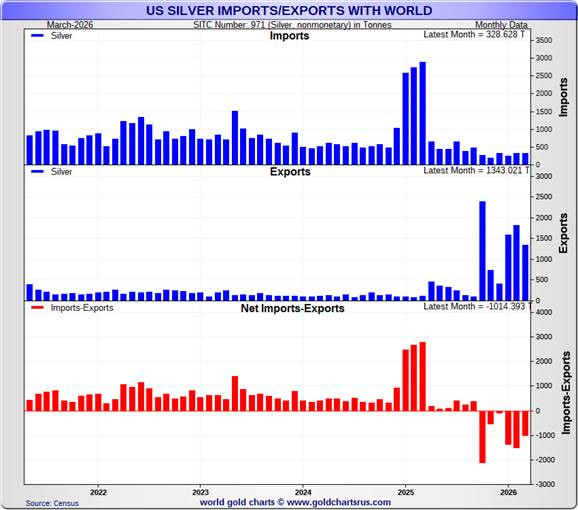
US silver flips to a record net export (~35M oz/month):
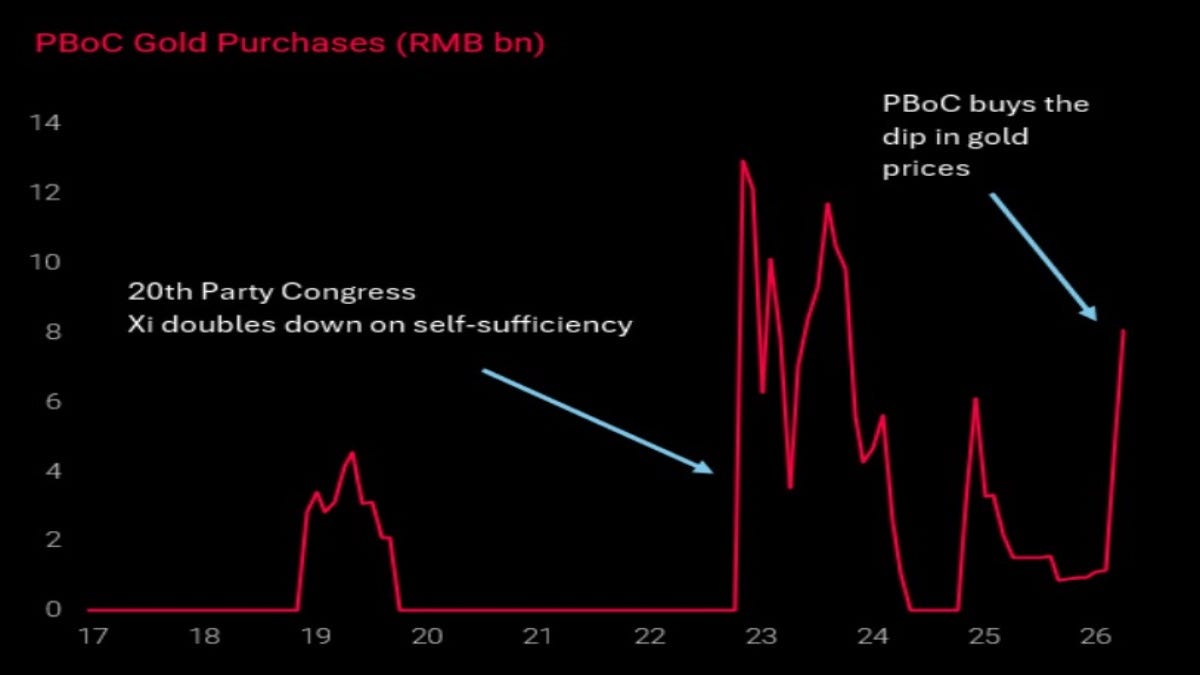
PBoC gold purchases (RMB bn): buying the dip:
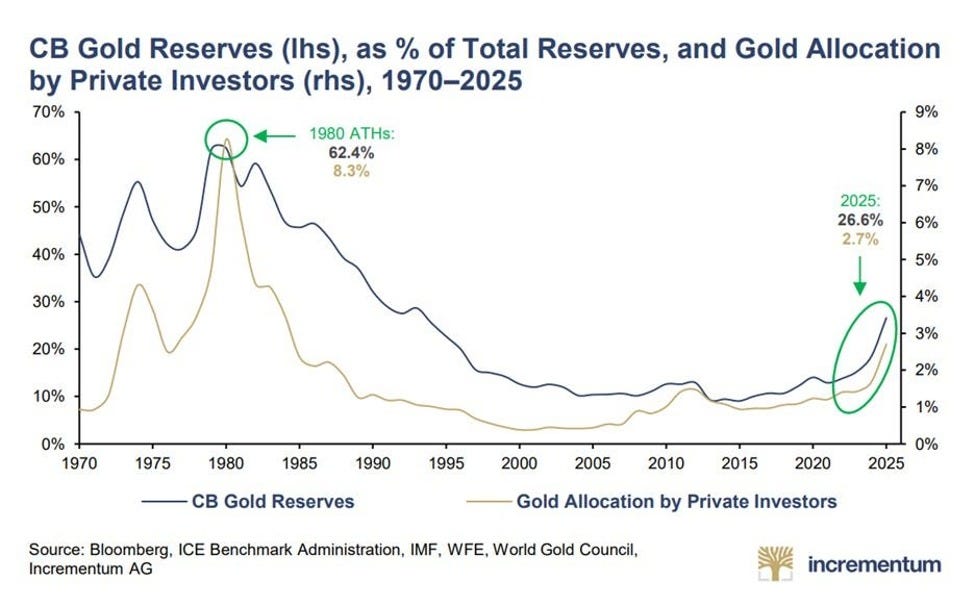
Central bank gold reserves: highest share of total since 1993:
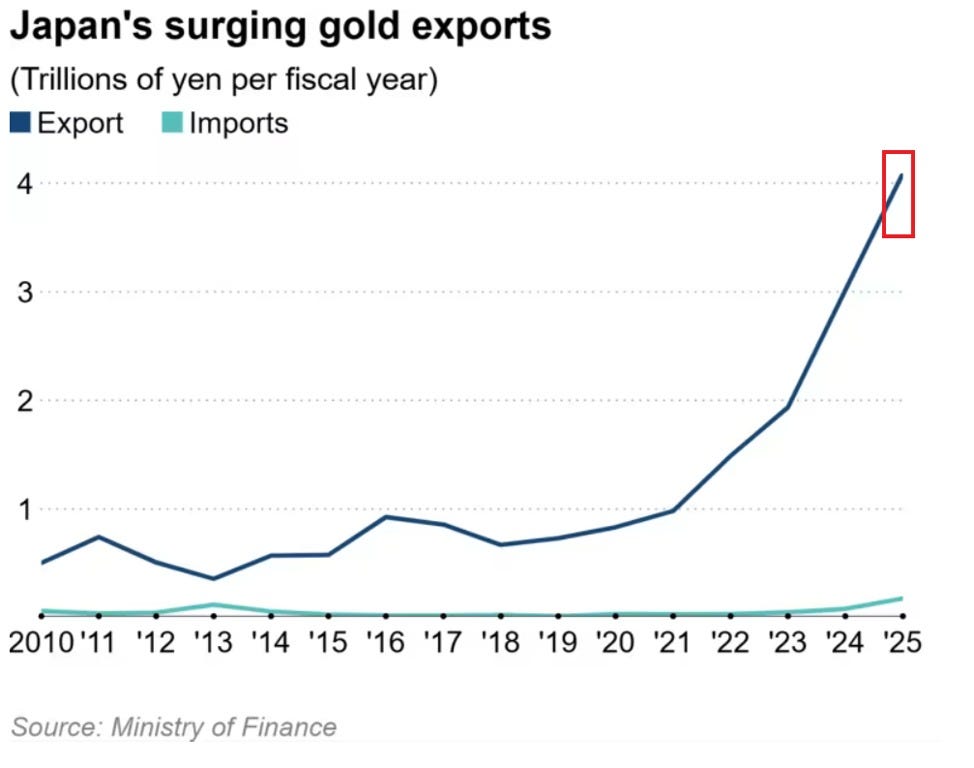
Japan's gold exports 🚀, highest since 1988:
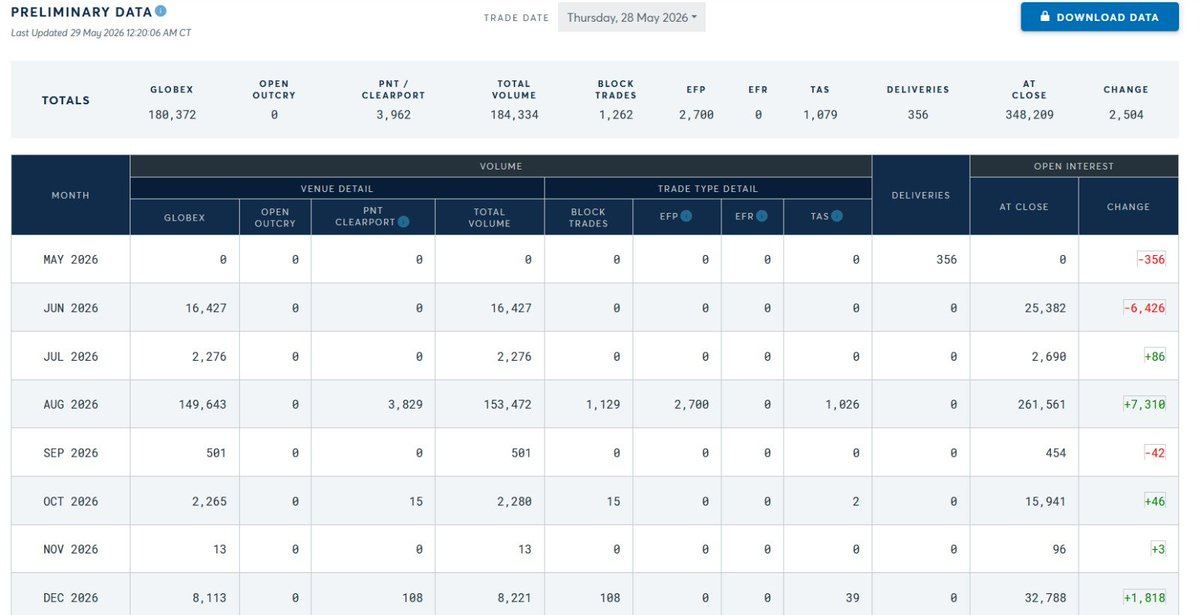
COMEX gold open interest: lowest since 2009 (348,209):
US gold still booked at $42.22/oz vs $4,000 market (8,133 tonnes):

Gold 1970-1980, from the Nixon Shock onward:

Gold vs the 10-year yield, breaking out:


Gold/silver ratio back at 60, still in a downtrend:


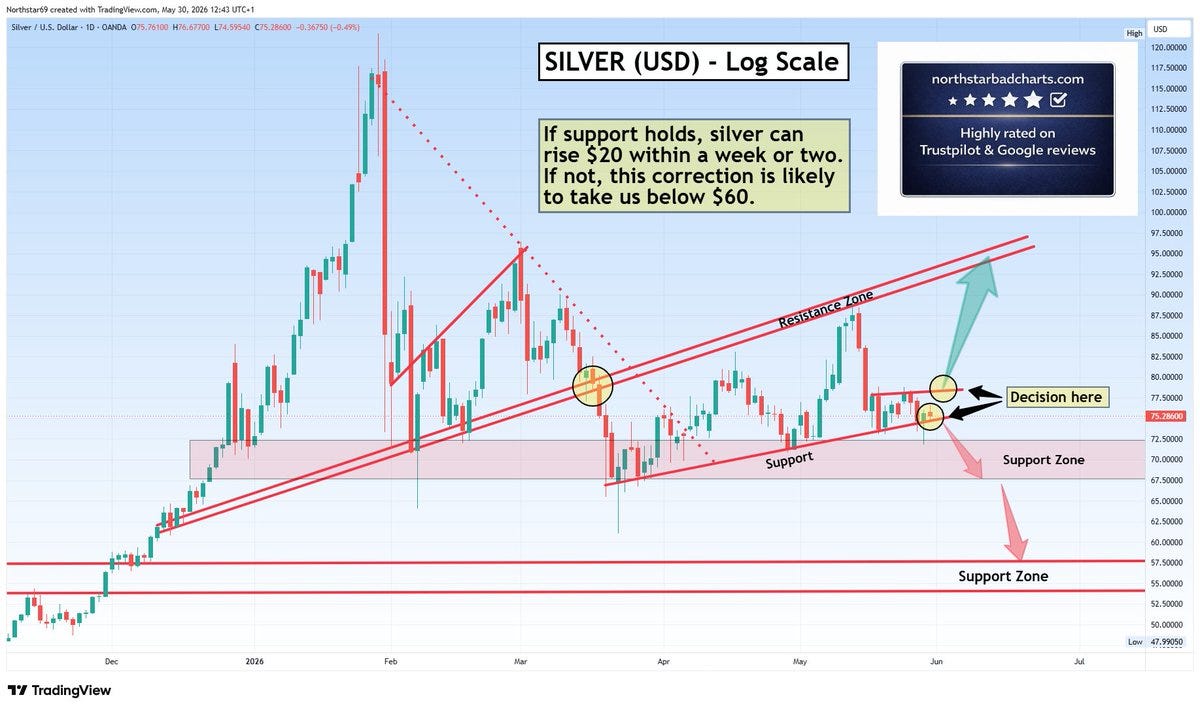
Silver at $75, support stacked down to $48-50:


Silver at a decision point (Don Durrett doesn't expect $67 to hold):
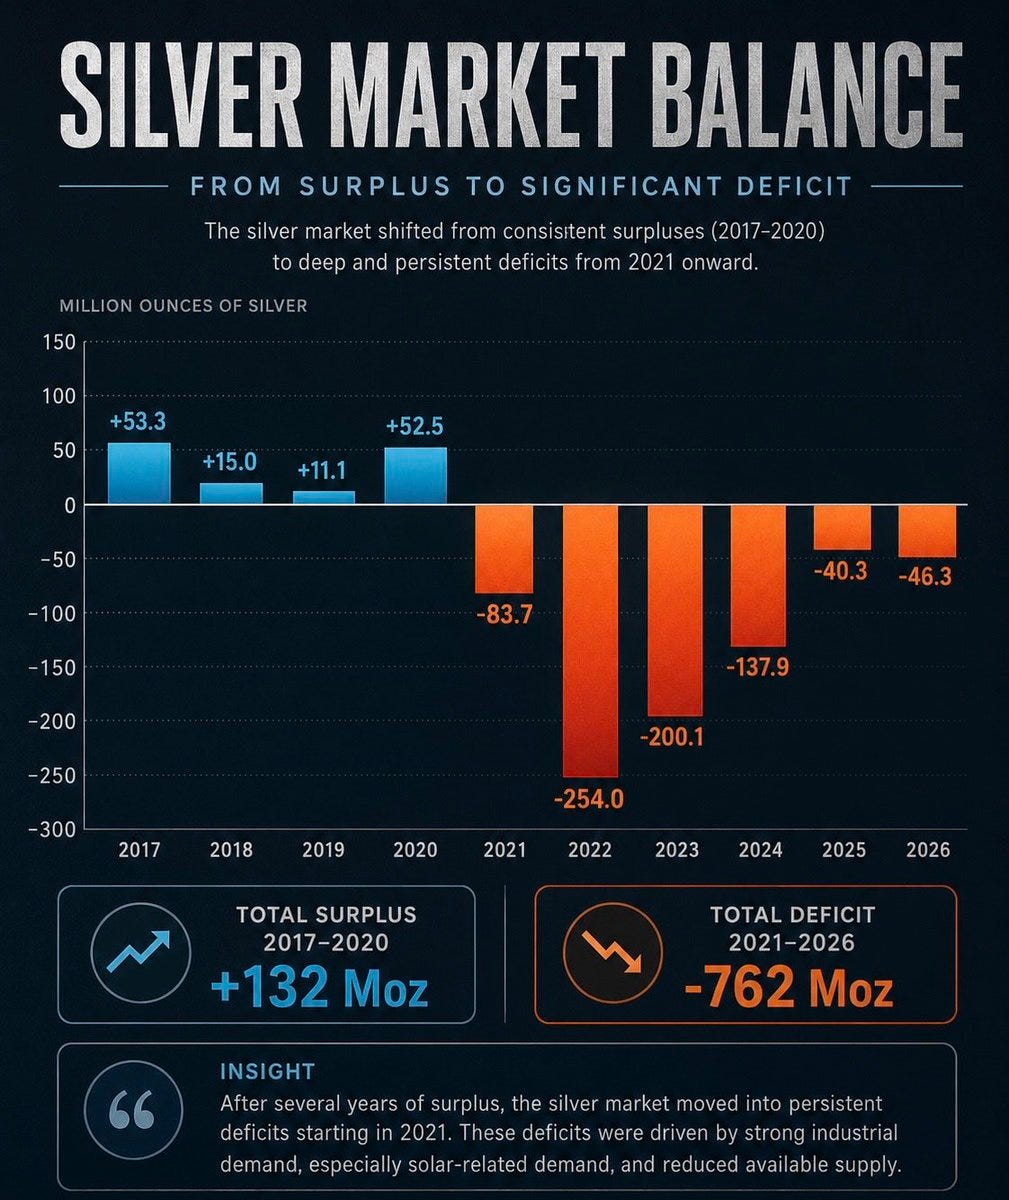
Silver market balance: +132 Moz surplus to -762 Moz deficit:
2026 Sound Money Index: gold & silver sales-tax map:

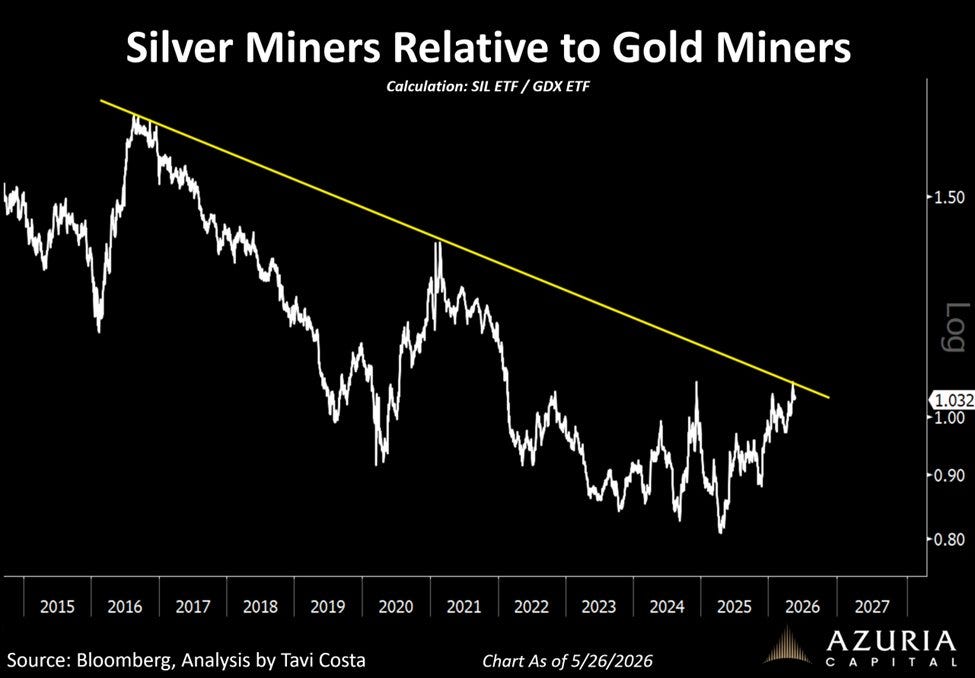
Silver miners relative to gold miners (SIL/GDX):
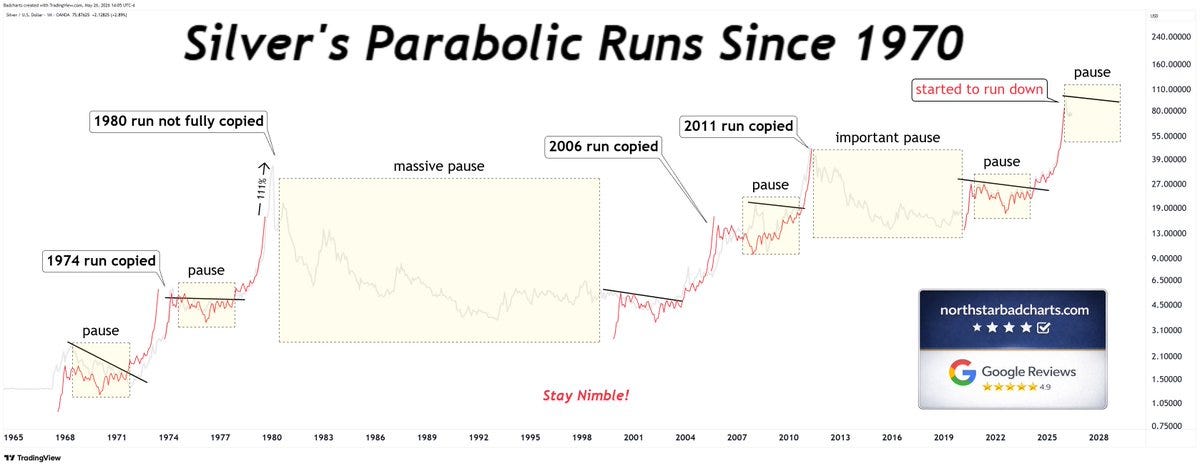
Silver's parabolic runs since 1970:
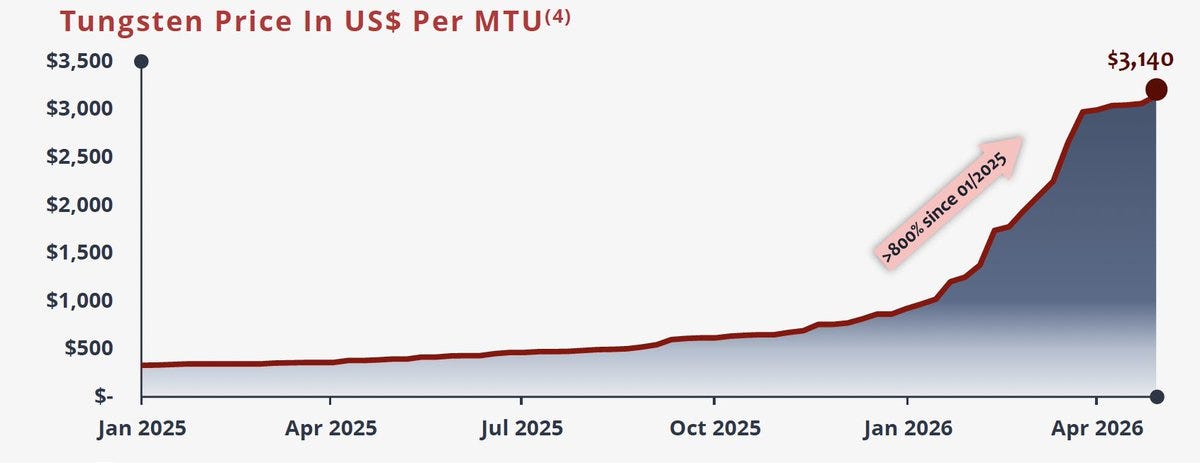
Tungsten price (US$/MTU) marching higher:
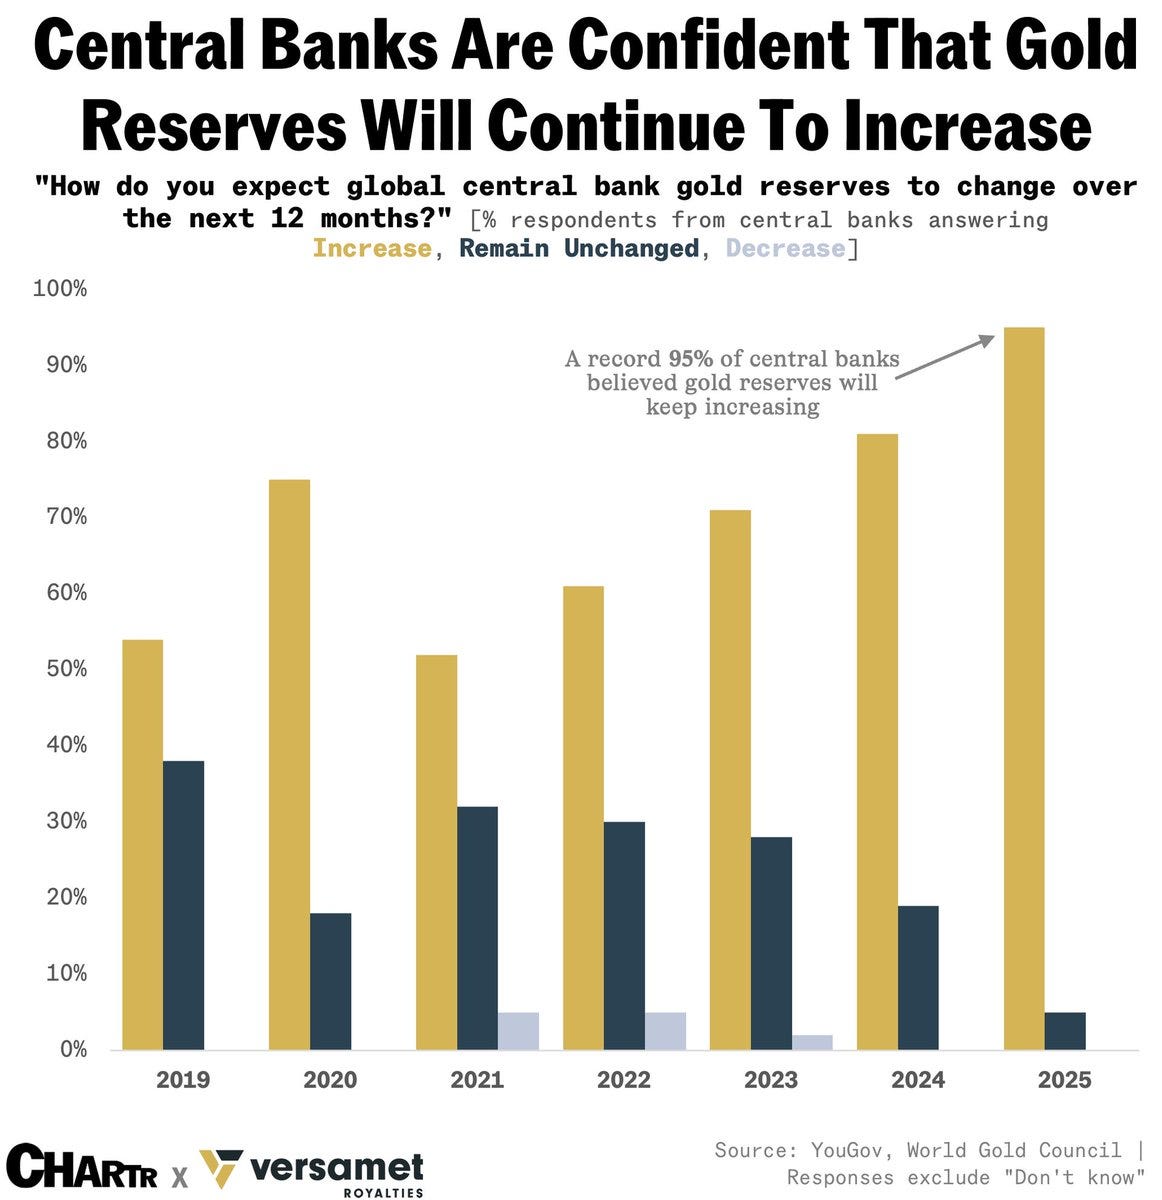
Record 95% of central banks expect gold reserves to keep rising:
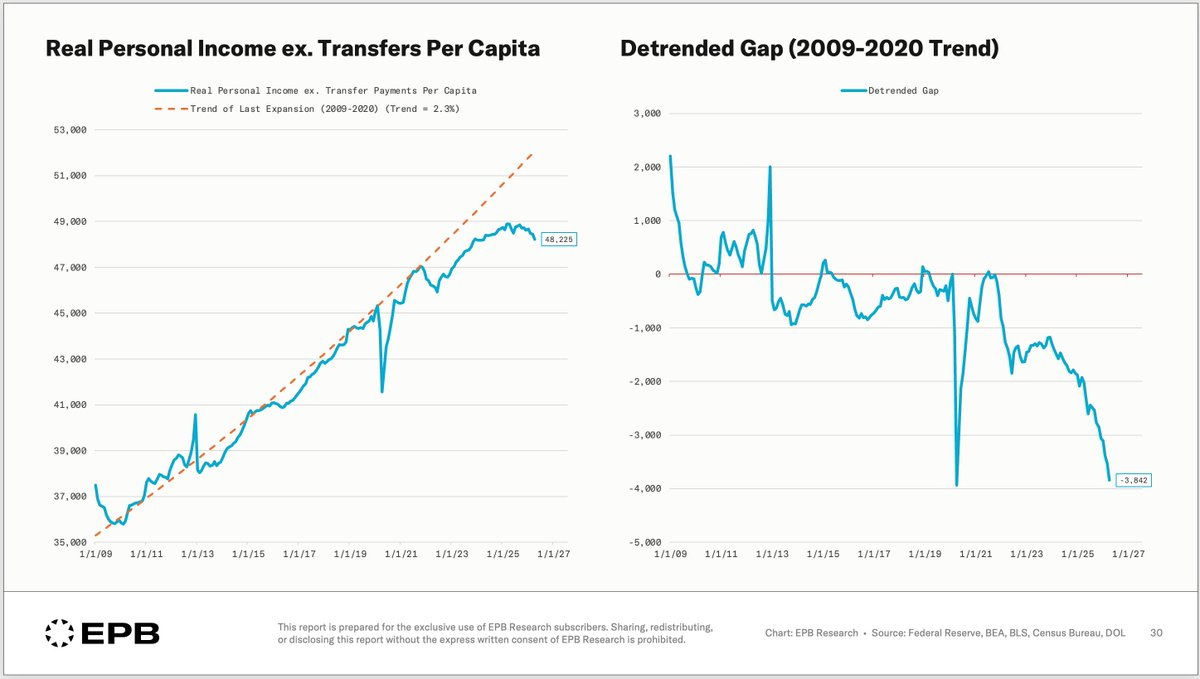
Real personal income ex-transfers vs the 2009-2020 trend:
ADP weekly employment: 'zero evidence' of AI job losses:


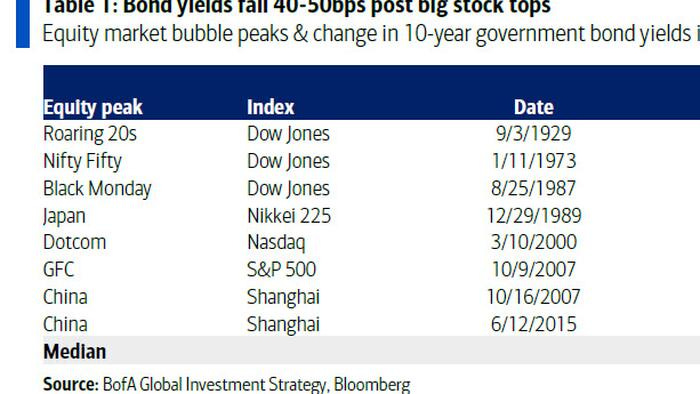
10-year yield changes after every equity bubble peak:
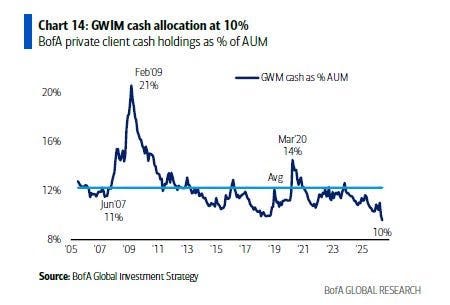
Wealth-management cash allocation at 10%, lowest in 20+ years:
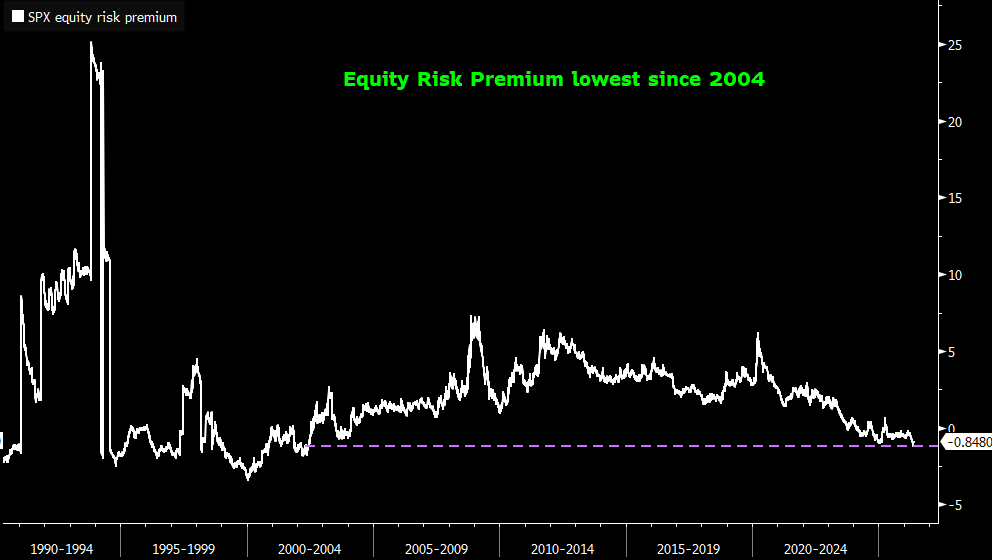
S&P 500 equity risk premium: lowest since 2004:
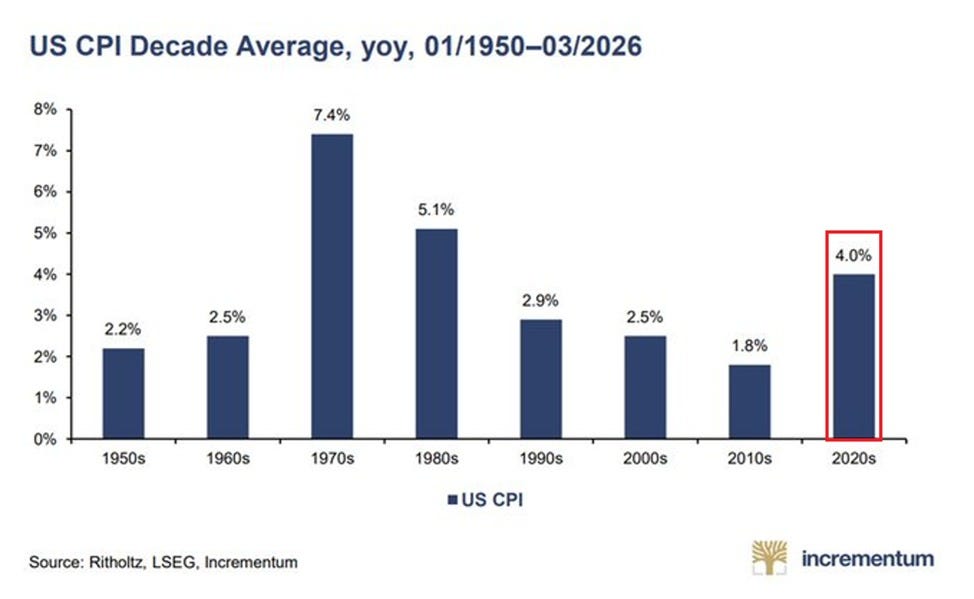
US CPI by decade:
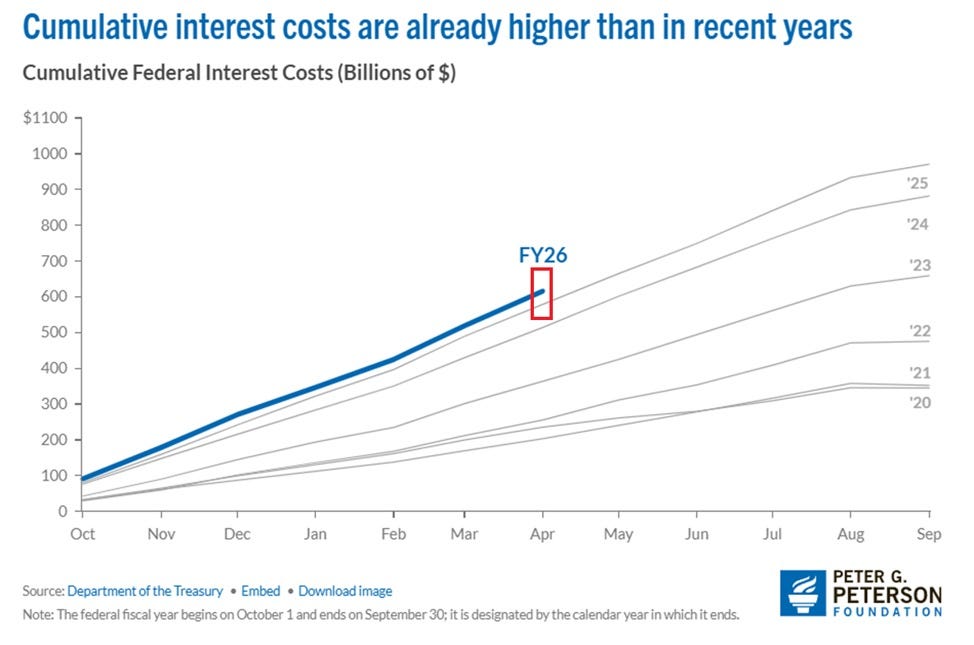
Cumulative federal interest costs: record $616B FY26:
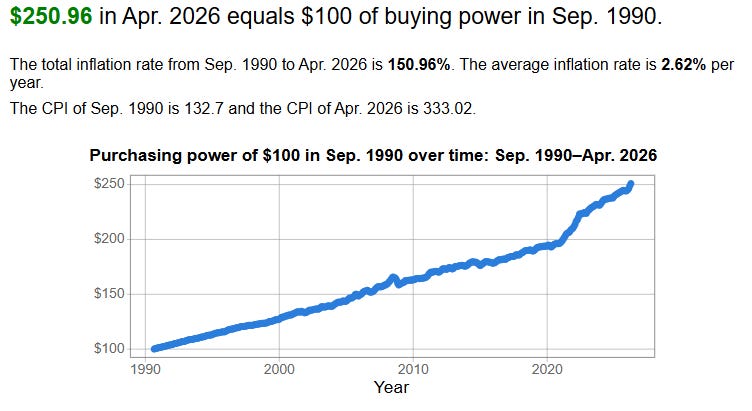
$250.96 today = $100 of Sep 1990 purchasing power:
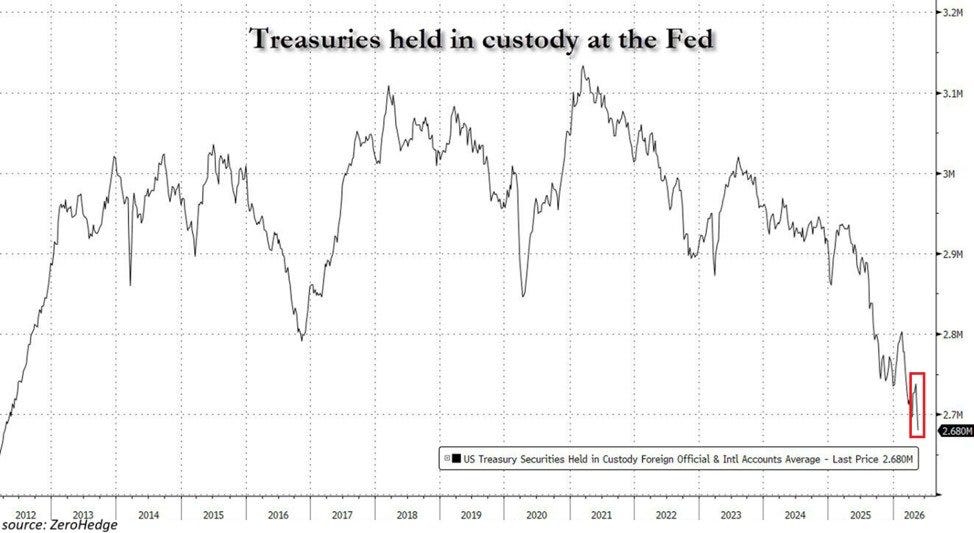
Foreign Treasuries in Fed custody: lowest since 2012:
UK 10-year gilt yield 🚀, highest since the 2008 crisis:
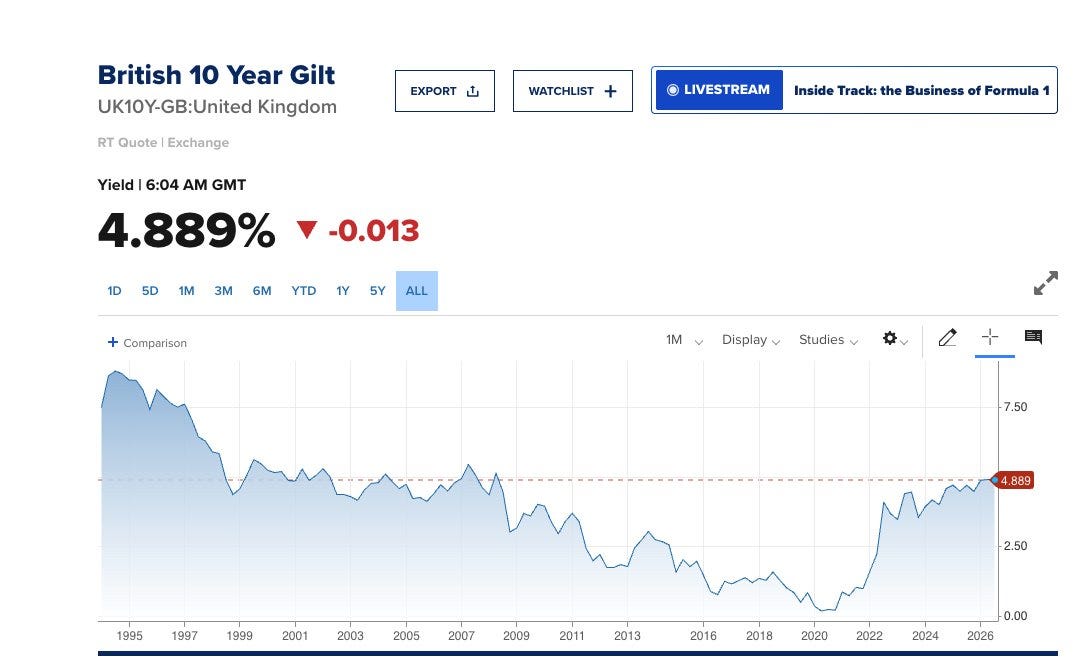
10-year yields: US 4.56%, UK 4.91%, Japan 2.75%, China 1.75%:


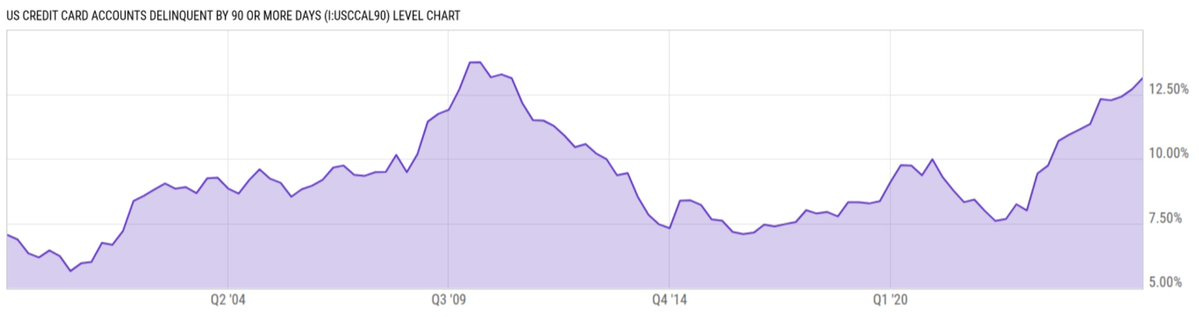
Credit-card 90+ day delinquencies: 13.1%, a 15-year high:
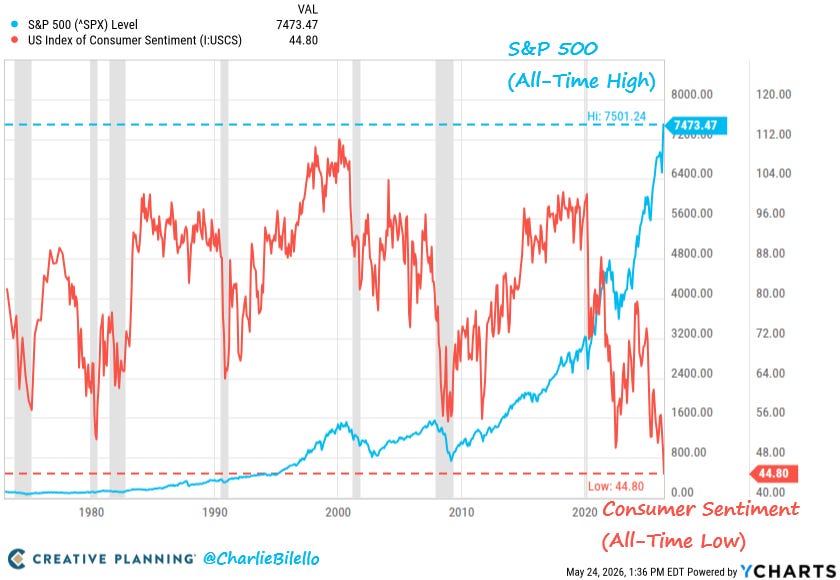
S&P 500 at record highs, consumer sentiment at a record low (44.8):
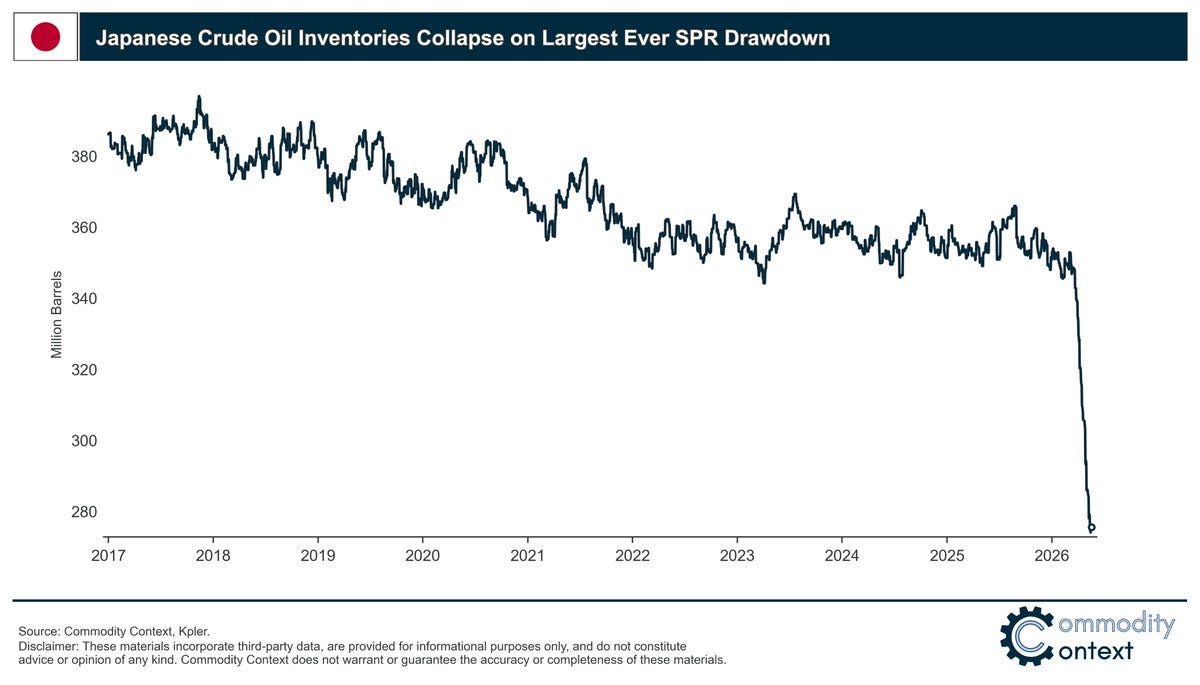
Japanese crude inventories collapse on the largest-ever SPR drawdown:
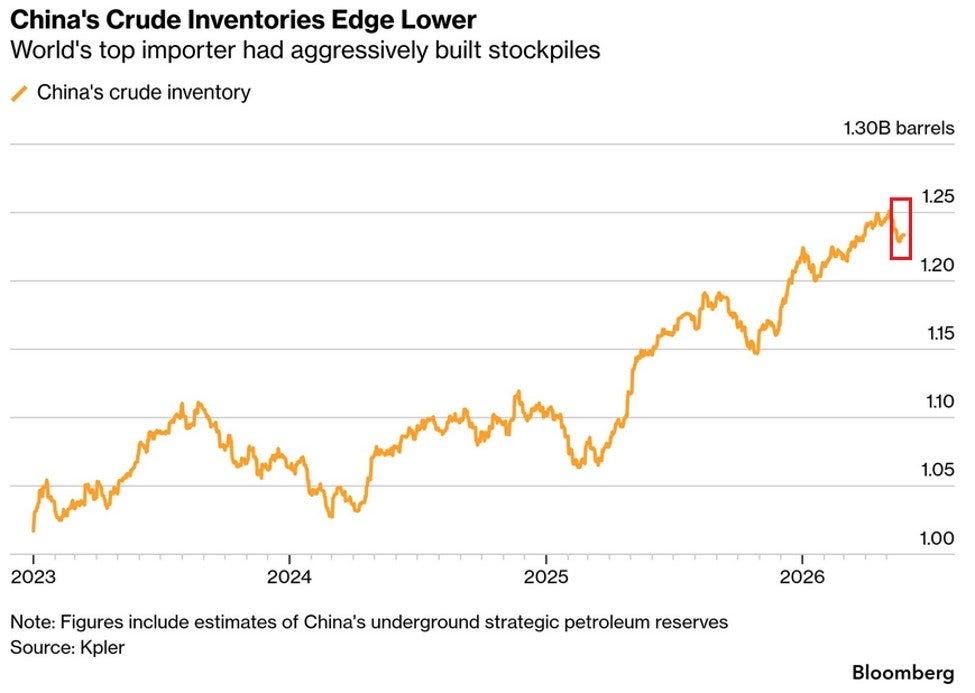
China's crude inventories edging lower after years of stockpiling:
US diesel, six months forward (the world runs on refined products):


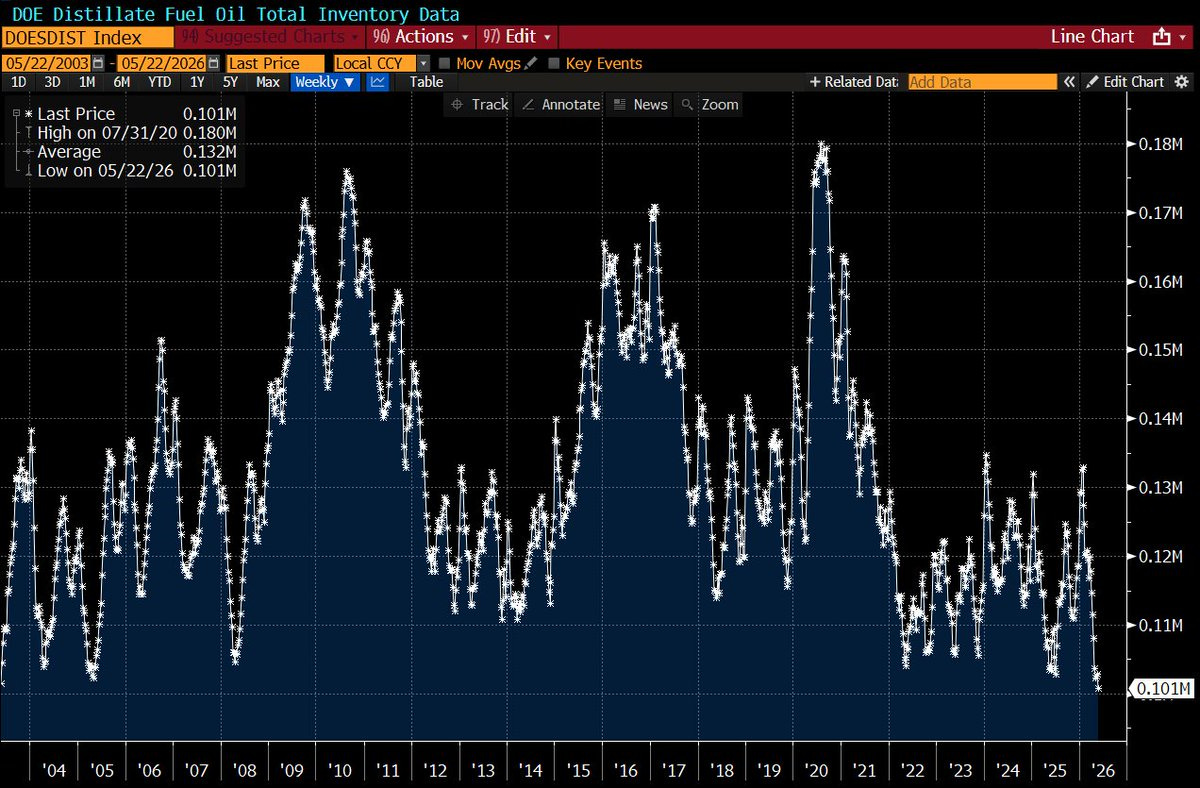
US distillate fuel inventories: lowest since 2003:
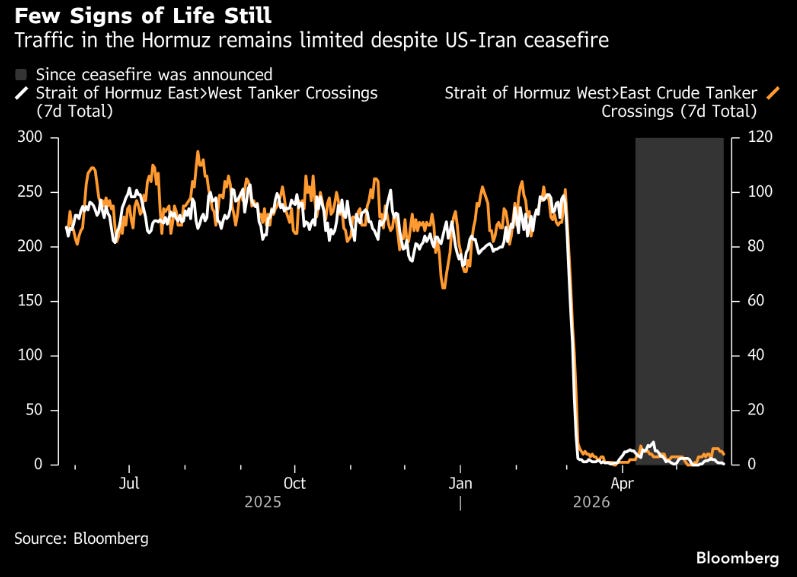
Strait of Hormuz tanker crossings still depressed since the “ceasefire”:
Asian crude imports: China plunging, India surging:


Dutch gas storage at 14.4%, far below the 72% EU target:

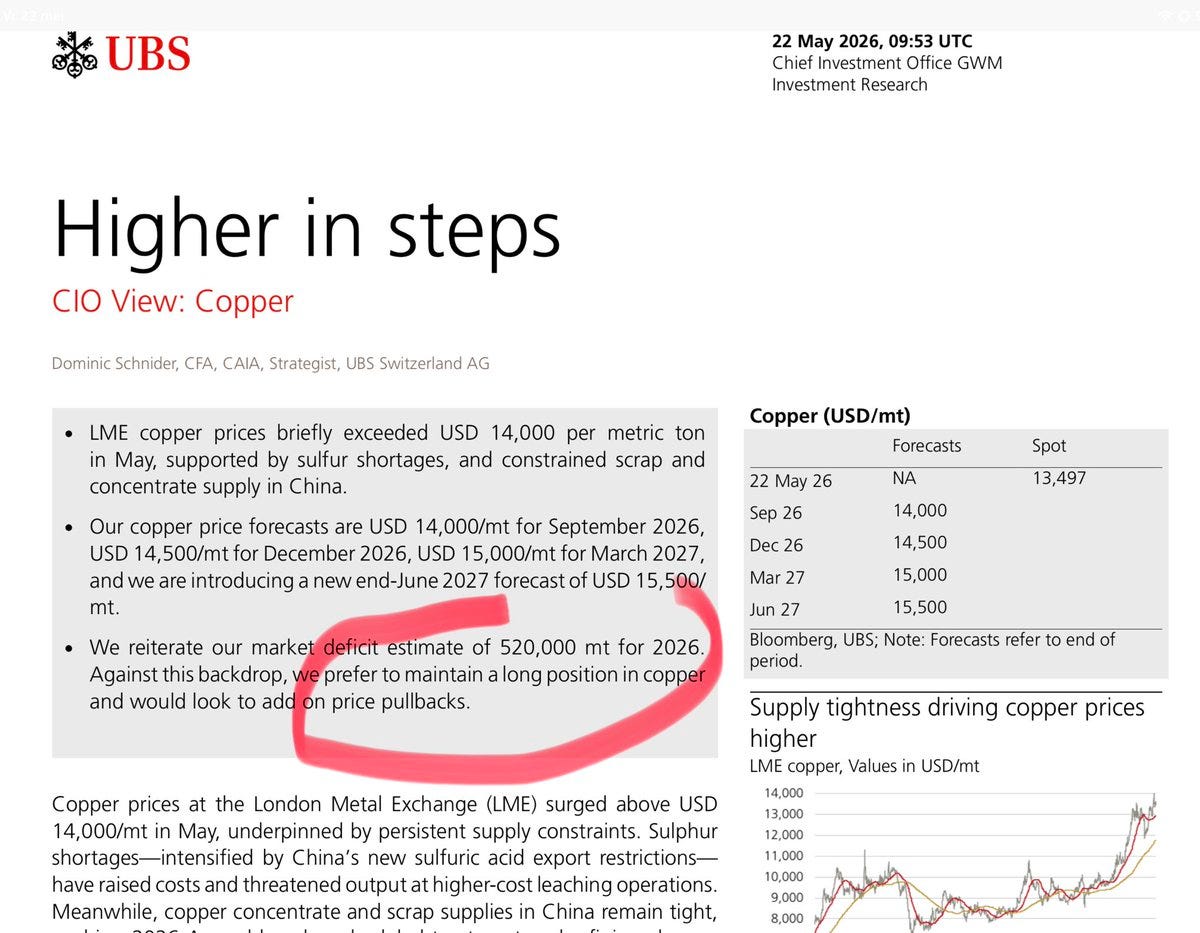
UBS sees copper at $15,500/mt by mid-2027:
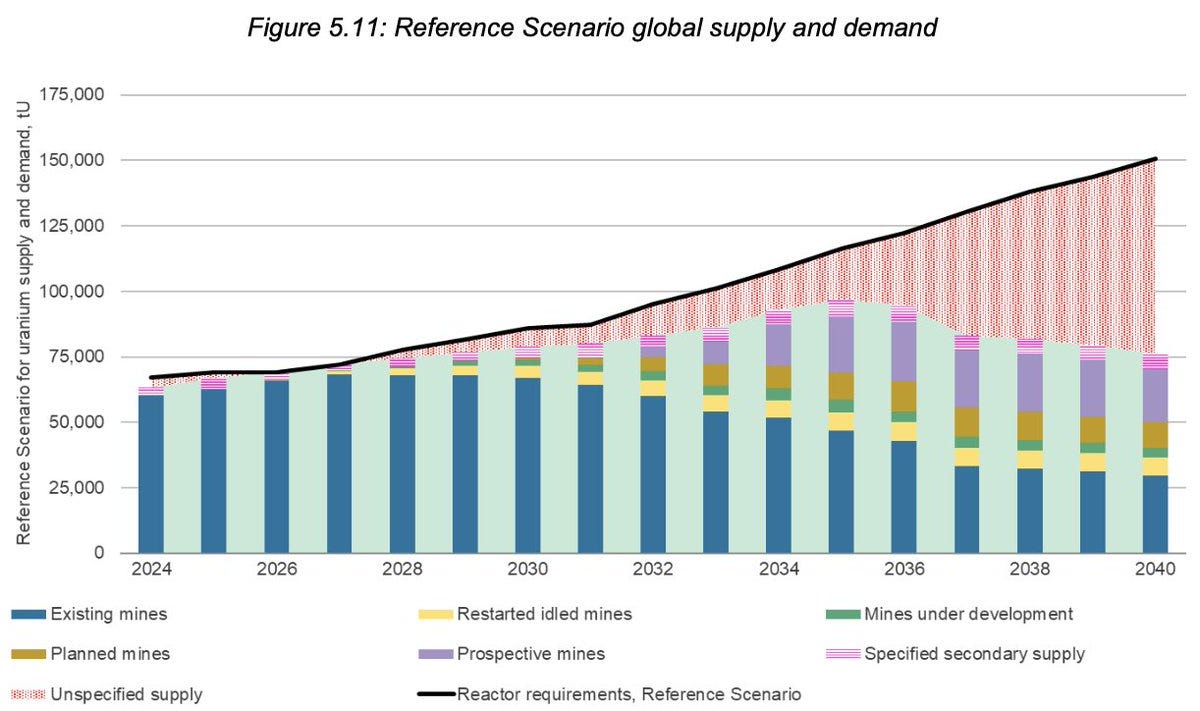
Uranium demand set to double by 2040:
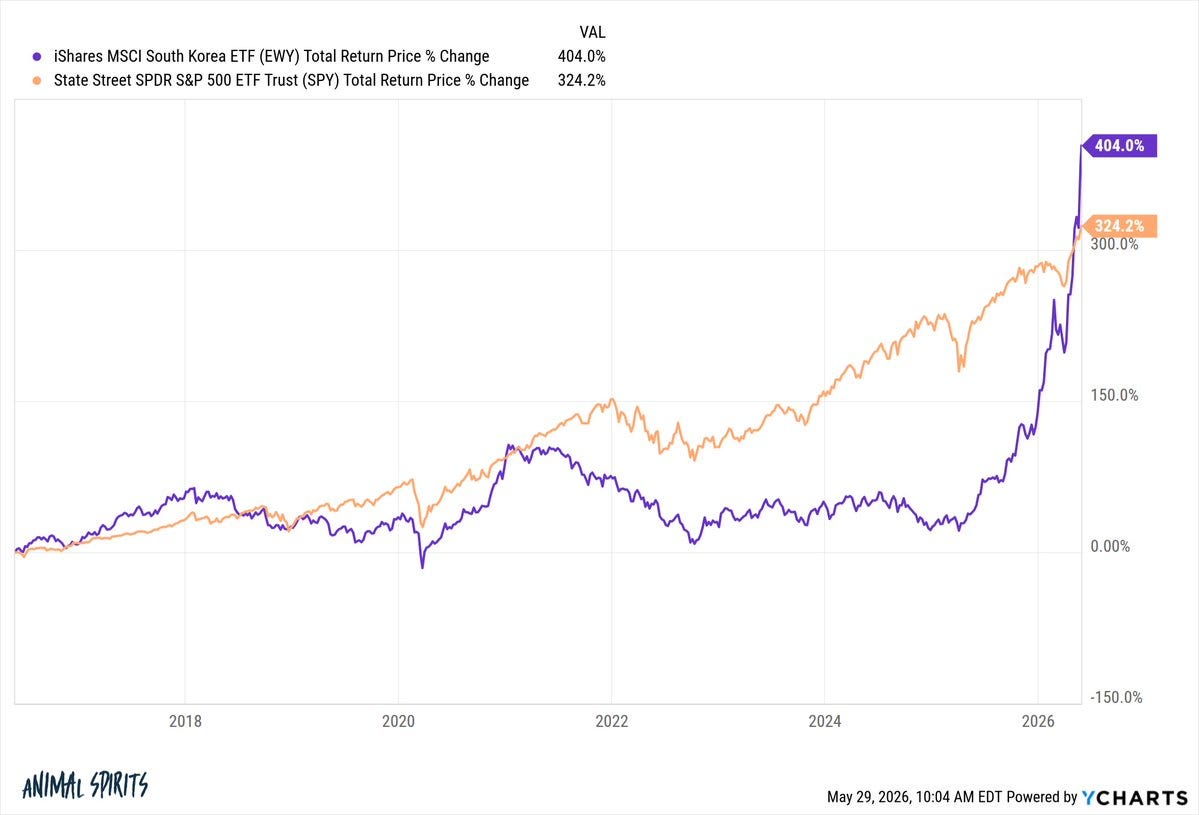
South Korea has now beaten the S&P 500 over 10 years:
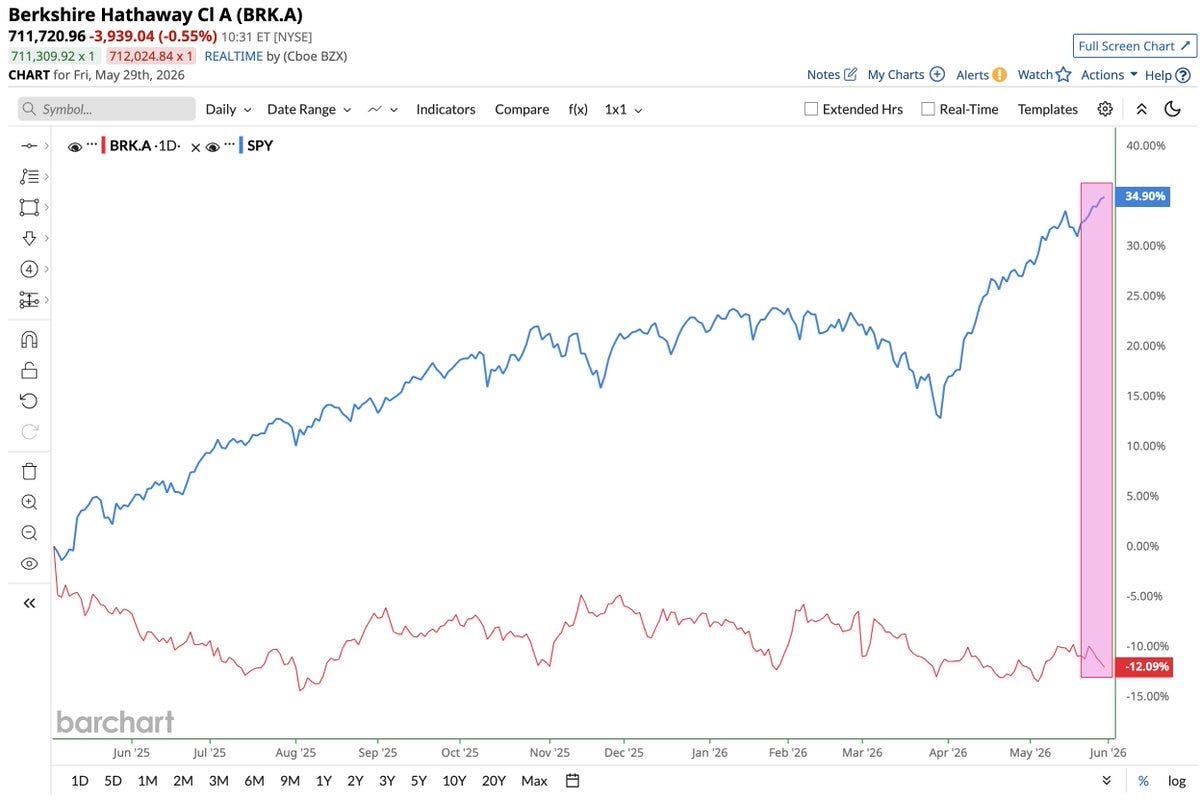
Berkshire trails the S&P by 47 points since Buffett's retirement:
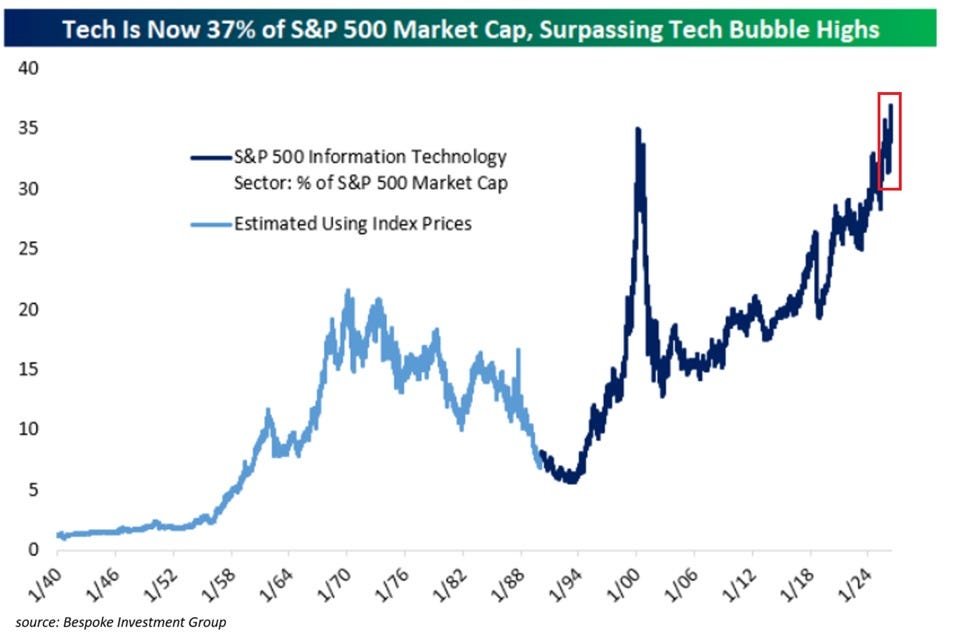
Tech now 37% of S&P 500 market cap, past the dot-com peak:
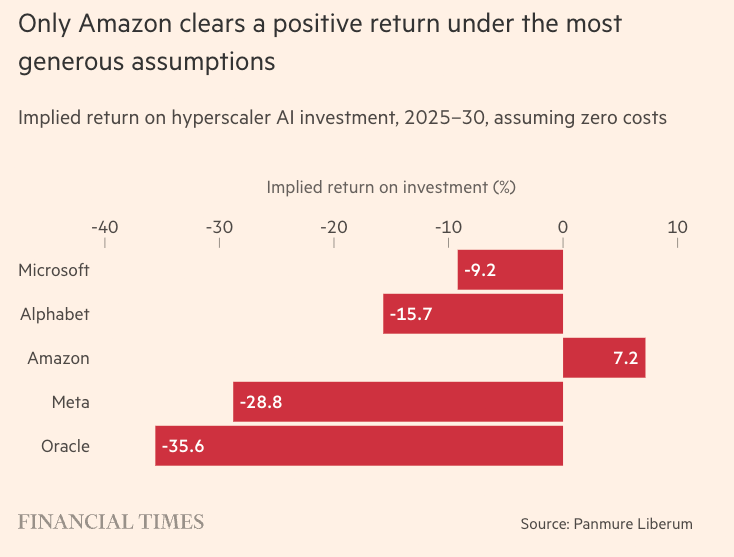
Implied return on hyperscaler AI spend: only Amazon clears positive:
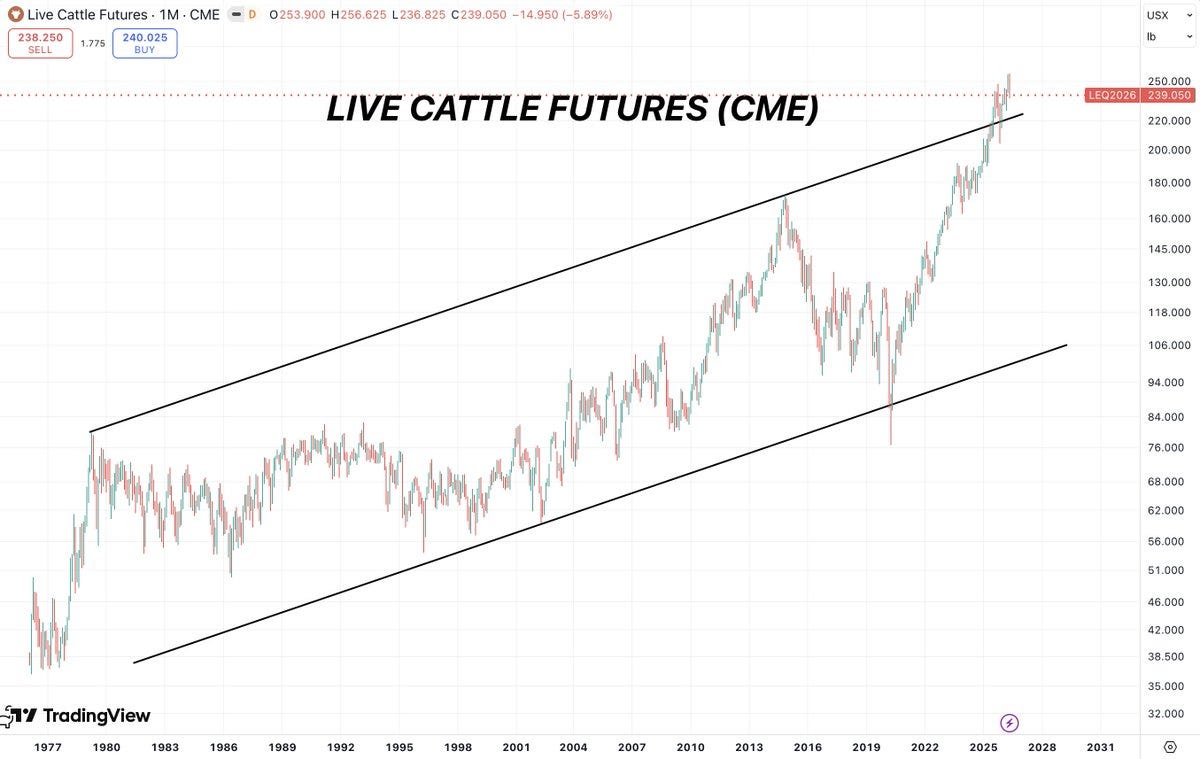
I’m gonna need a 🐃:

I can't tell when the bottom will fall out.
It's like a Jack-in-th-Box... Just keep turning the crank and making the music.
... Pop Goes The Weasil... ;-)
that tungsten chart is “interesting”…!
i drift back to a mining play i dabbled in 30+/- years ago <TSX:NTC>…
back then tungsten was languishing well under $100/t…
”In the late 20th century, several mines were established, such as the Cantung Mine in the Northwest Territories, which became one of Canada's primary sources of tungsten.
The Mactung property is considered to be among the world’s largest high-grade deposits of tungsten.
However, by the early 2000s, economic pressures led to widespread tungsten mine closures and reduced output.“
fwiw, NTC (finally) shut down in 2015…
today, with ‘W’ over $3k/t ---> it’s just another pipe dream to ponder those huge capital gains that might have been if ntc had stayed solvent…?
sobeit…
but "W" (#74) now seems to be rising phoenix-like from the ashes for a new lease on life...!
dyodd...?